
10 Key Takeaways
1. How inclusive are we — really?
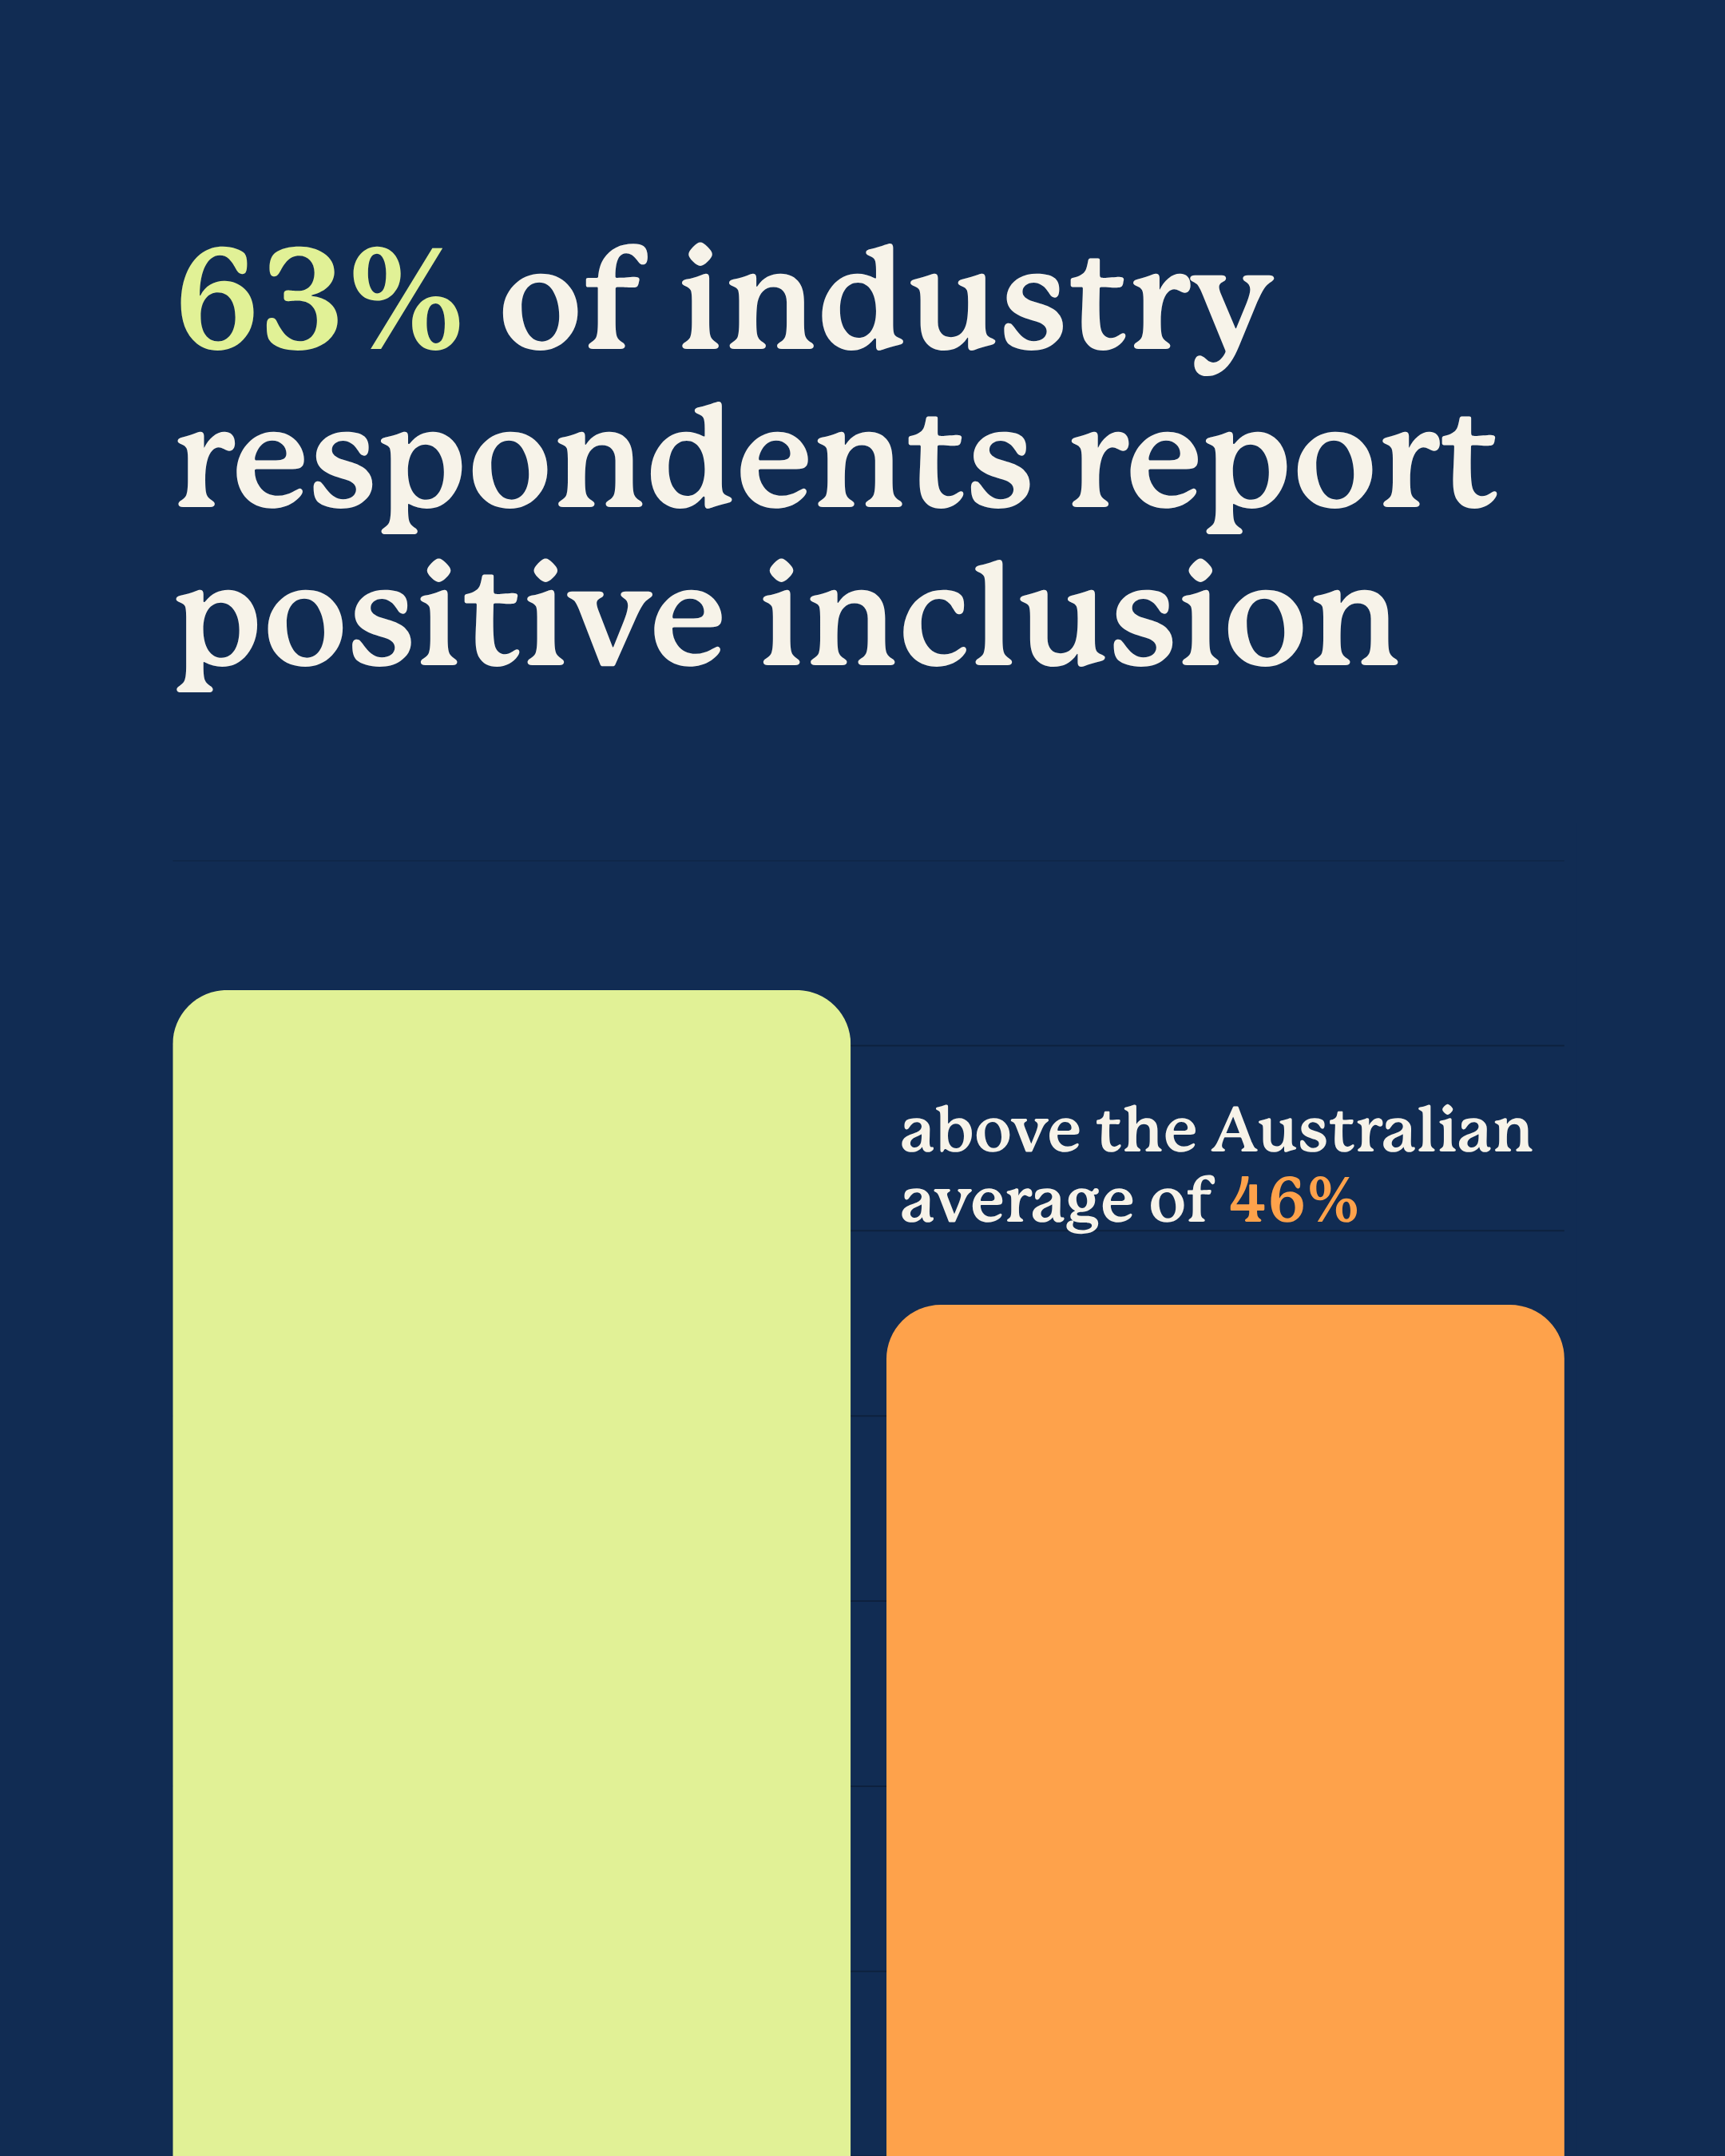

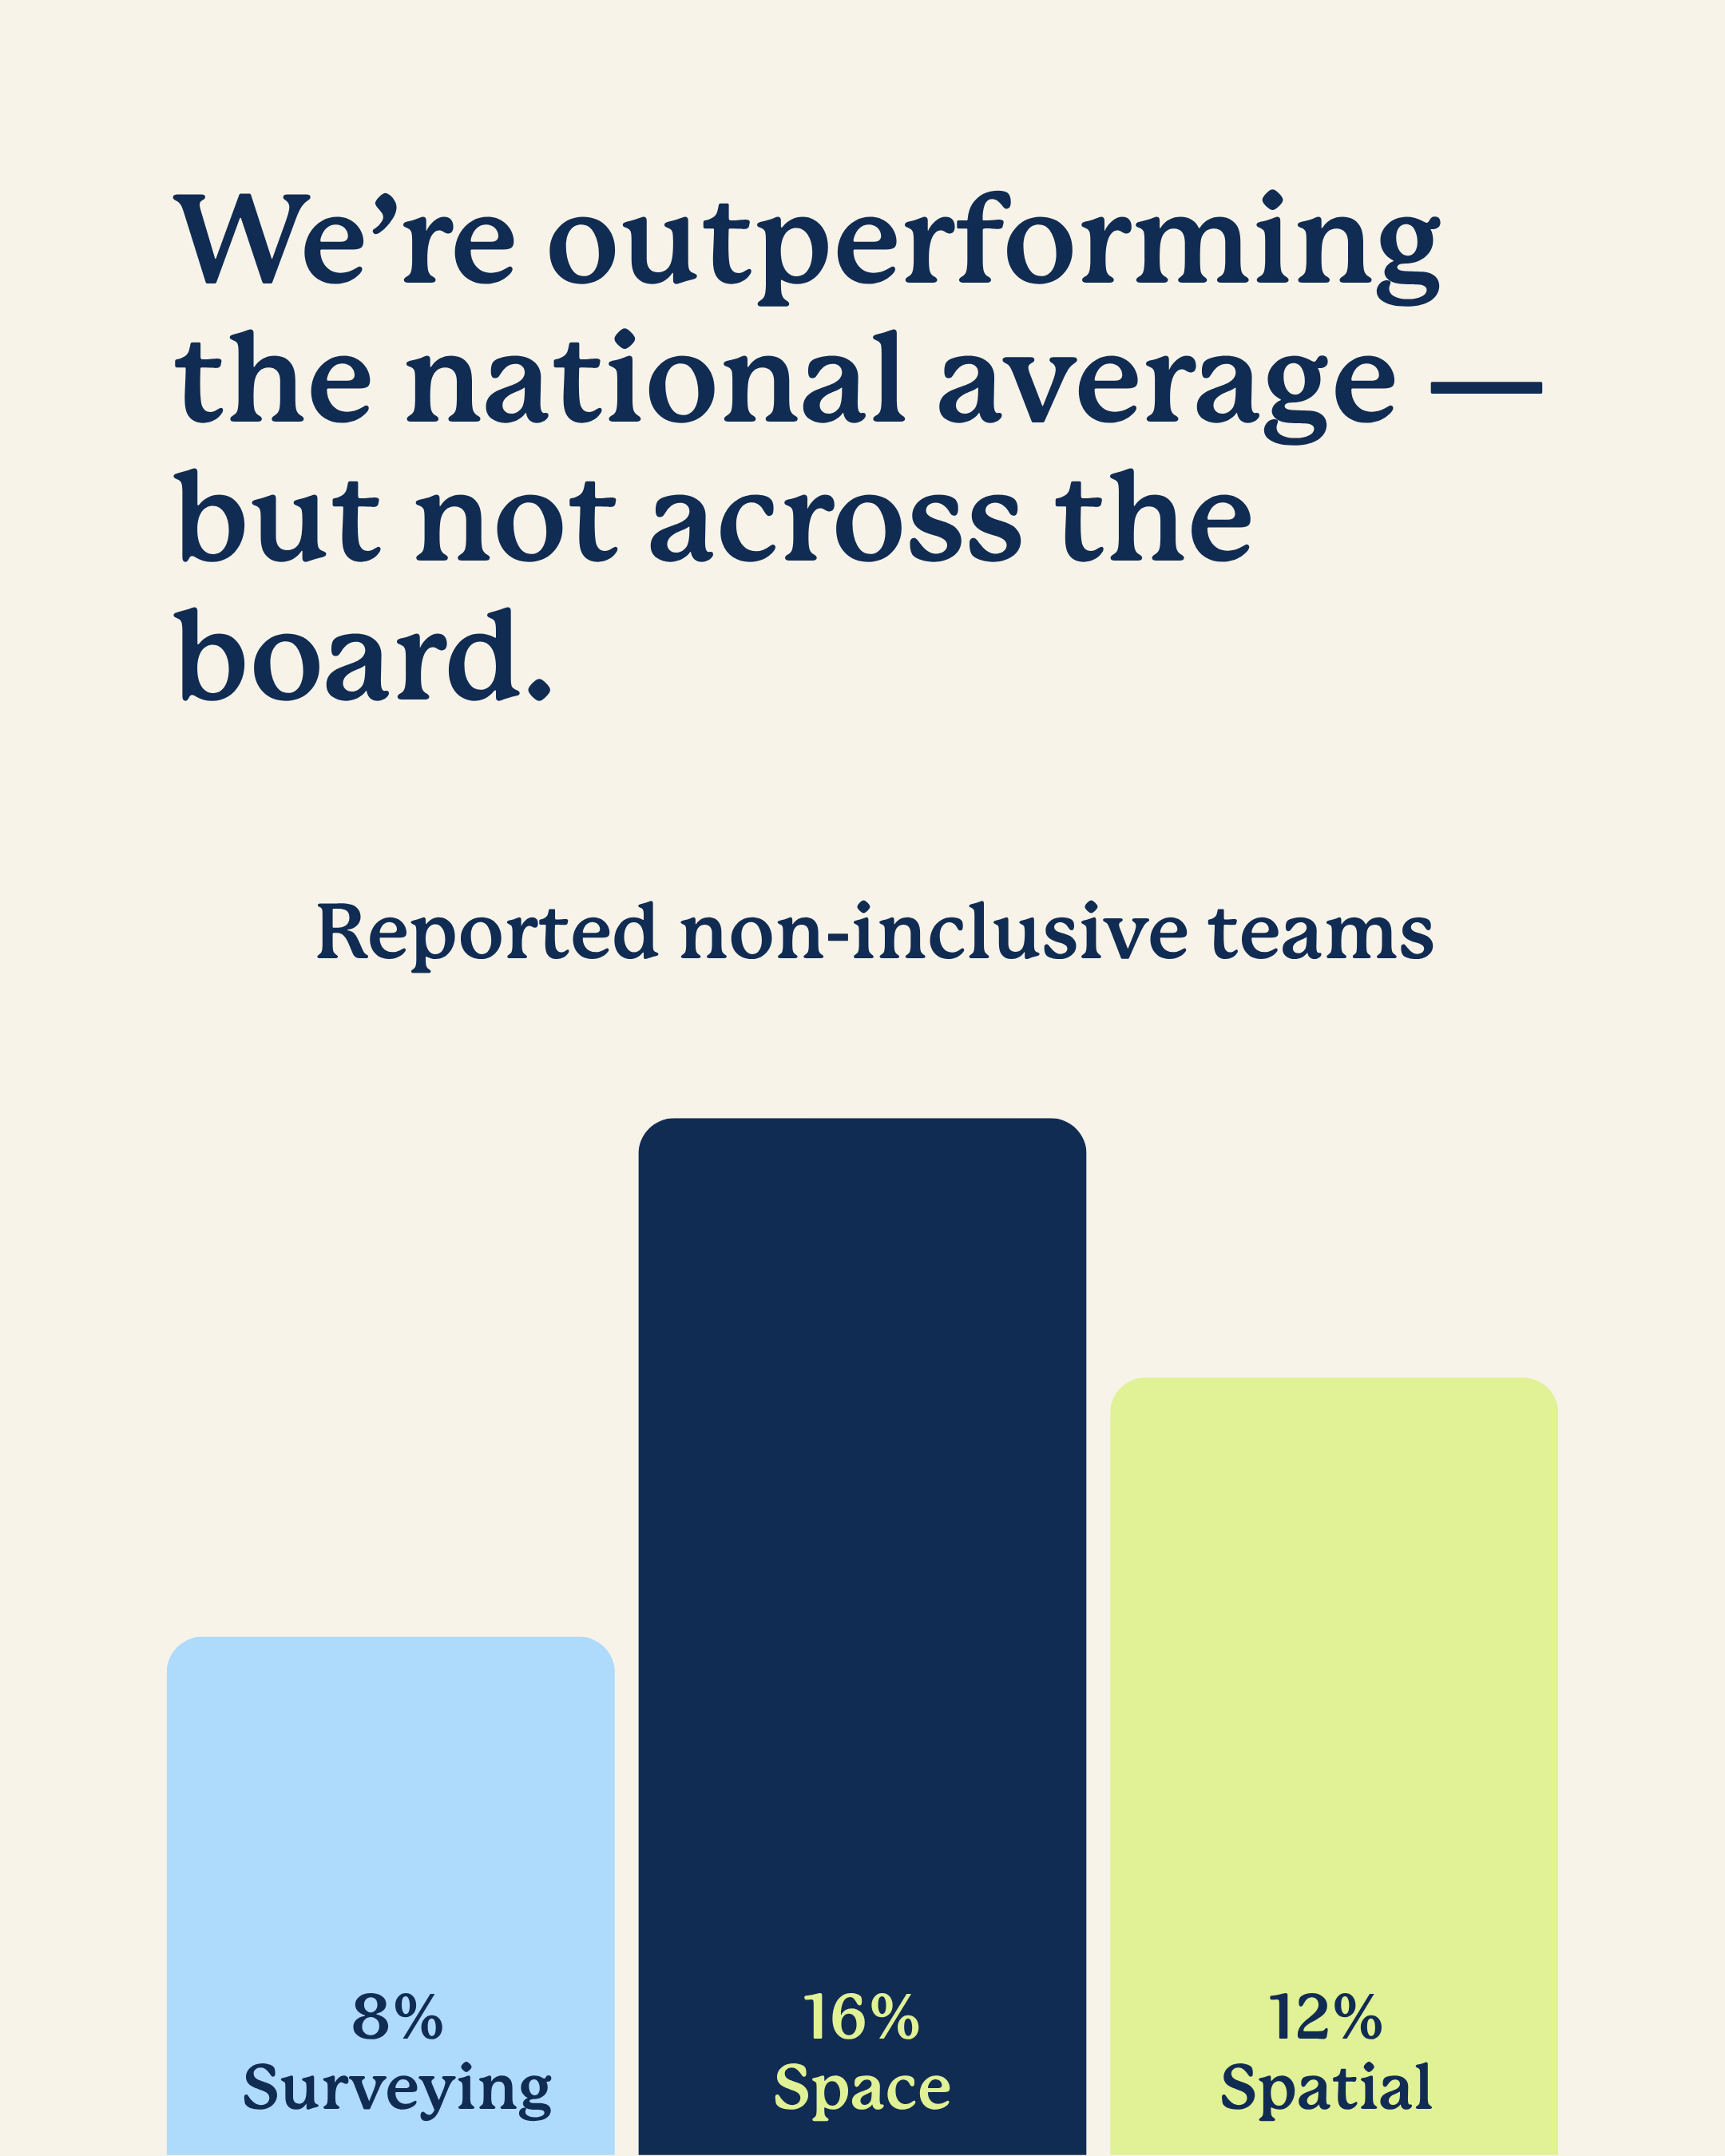
The latest SSSDLN data shows our sectors outperform the national average on inclusion — but there’s still work to do.
63% of respondents report a positive inclusion experience — well above the national average of 46%.
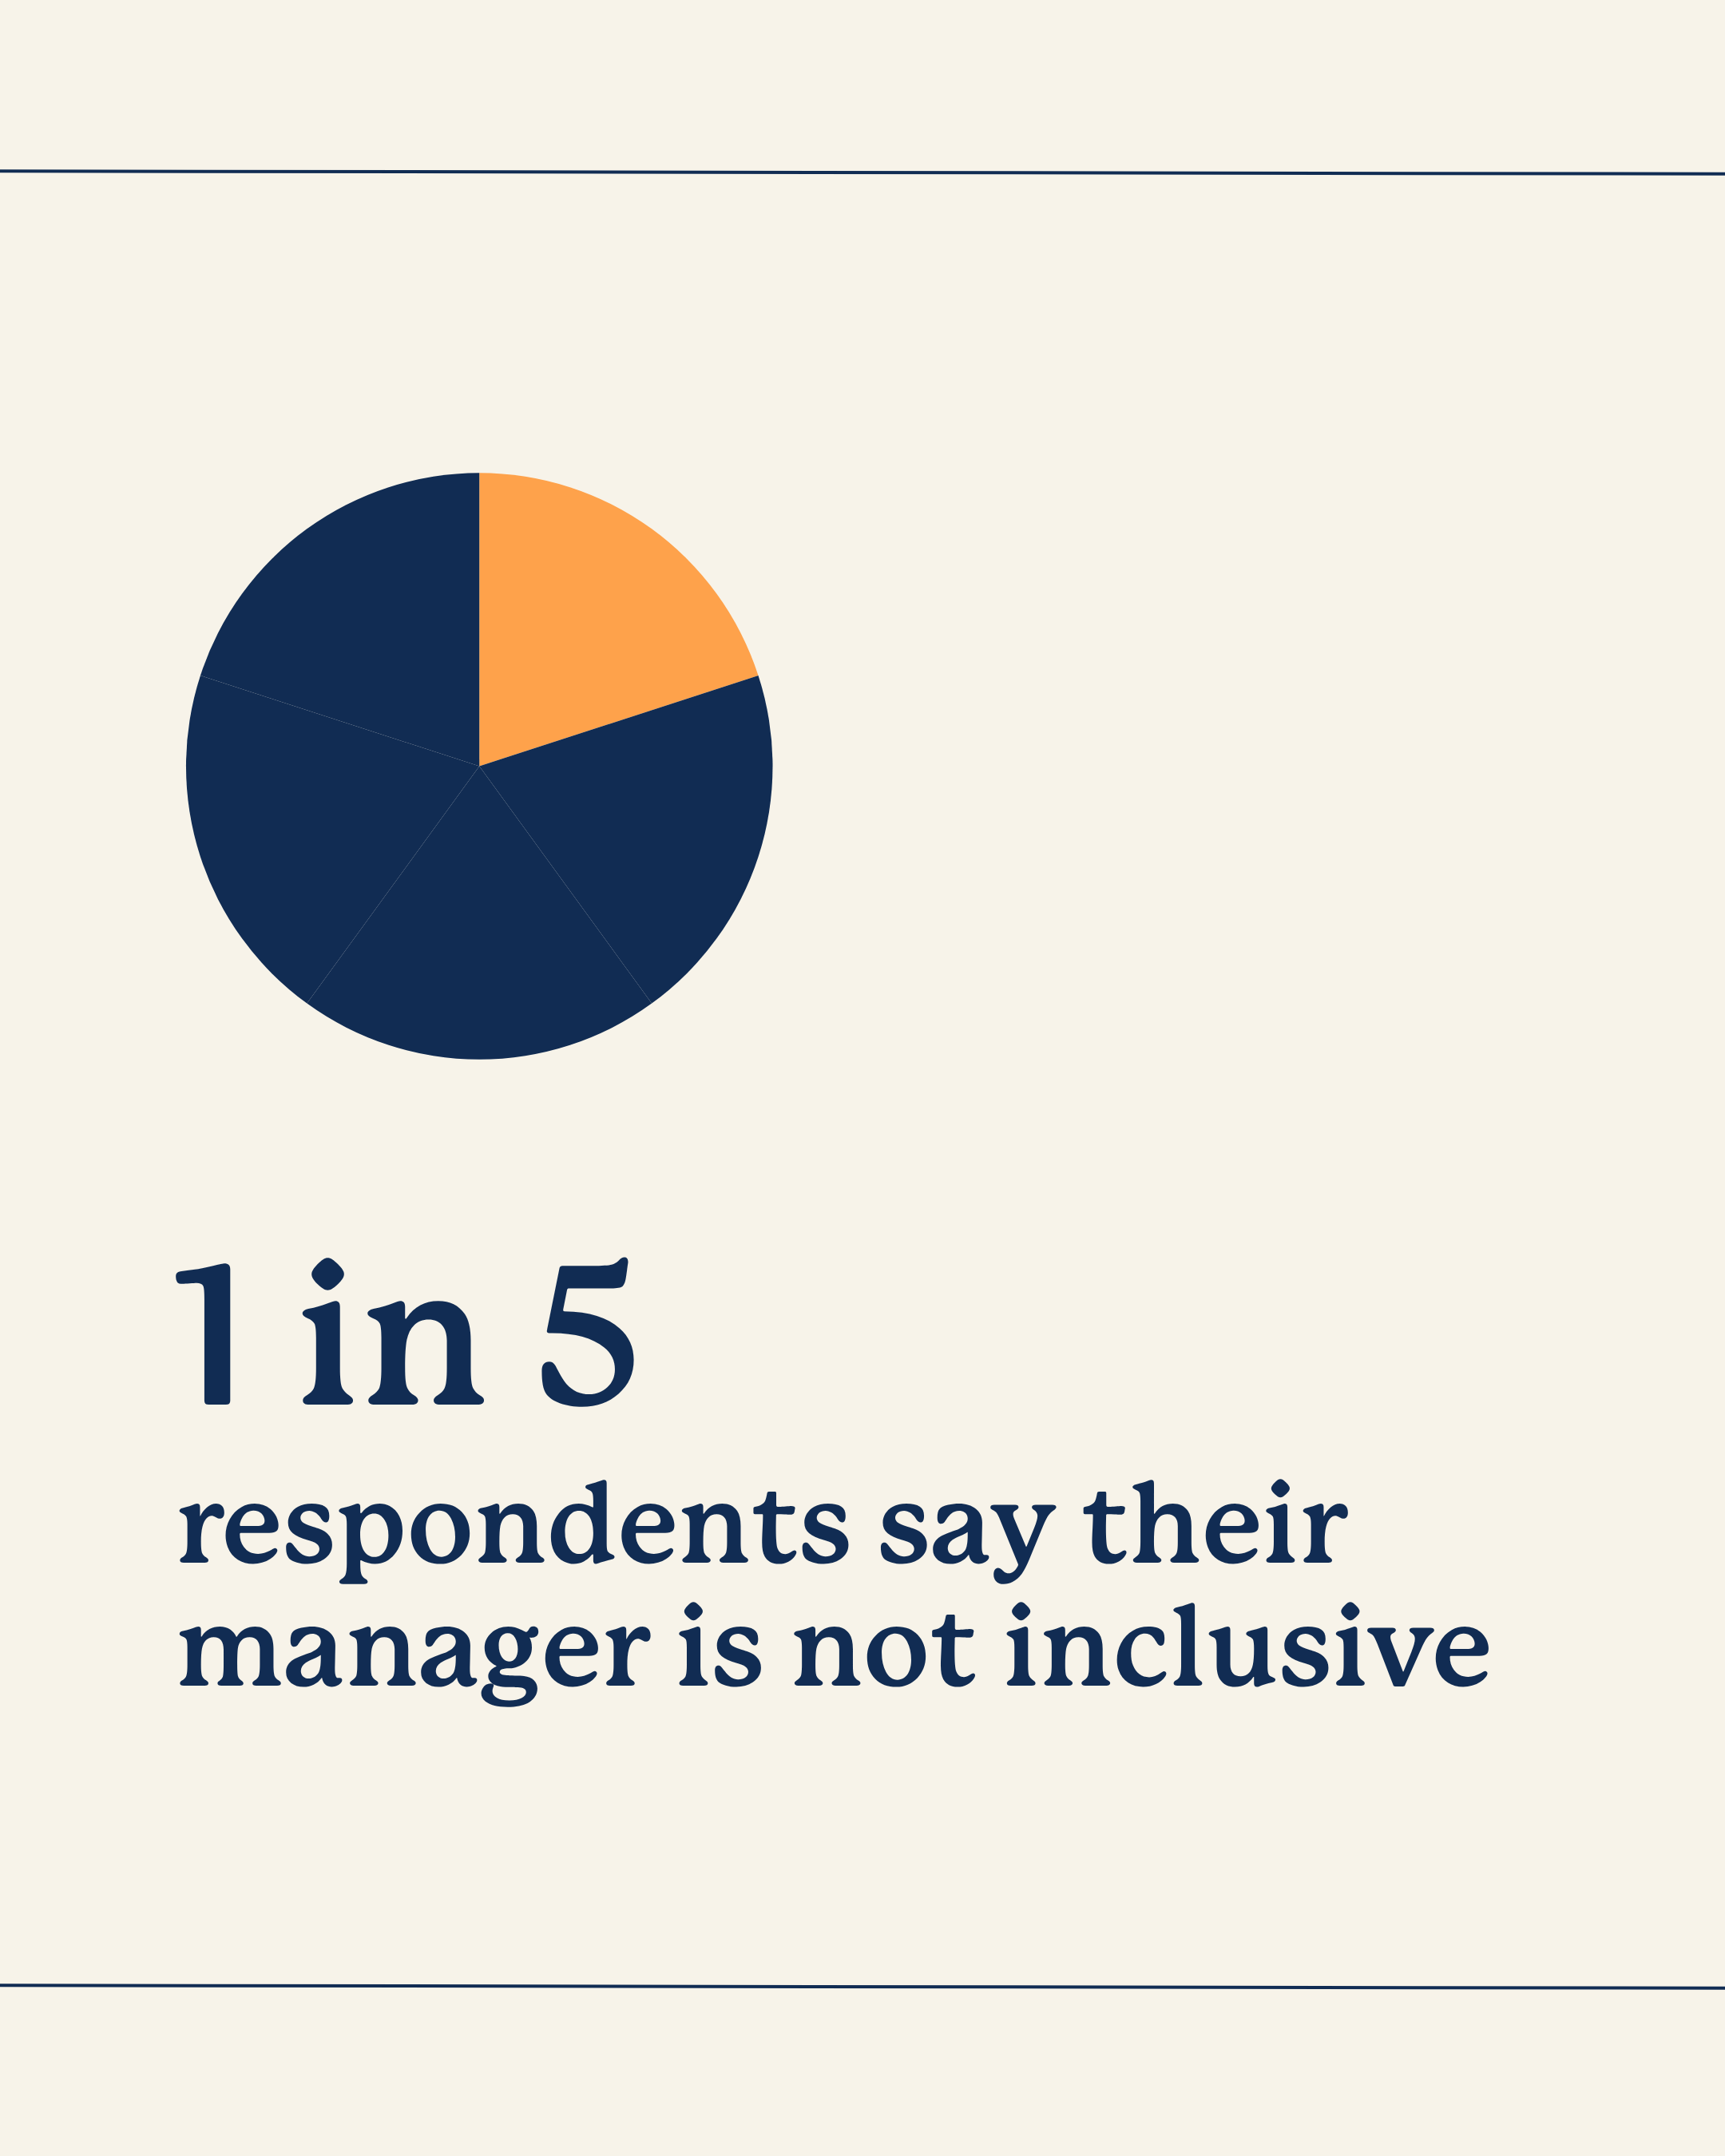
Nearly 1 in 5 say their manager is not inclusive.
The business sector leads on both inclusion and job satisfaction, with Government and Academia trailing behind.
There’s plenty to be proud of — and clear signals on where we need to lift.
2. We’ve made progress — and we’re not done yet.


For the first time, we can see how inclusion has shifted over time across the space, spatial and surveying sectors.
90% of respondents still support D&I action — unchanged since 2021.
Job satisfaction remains high in inclusive teams (63%).
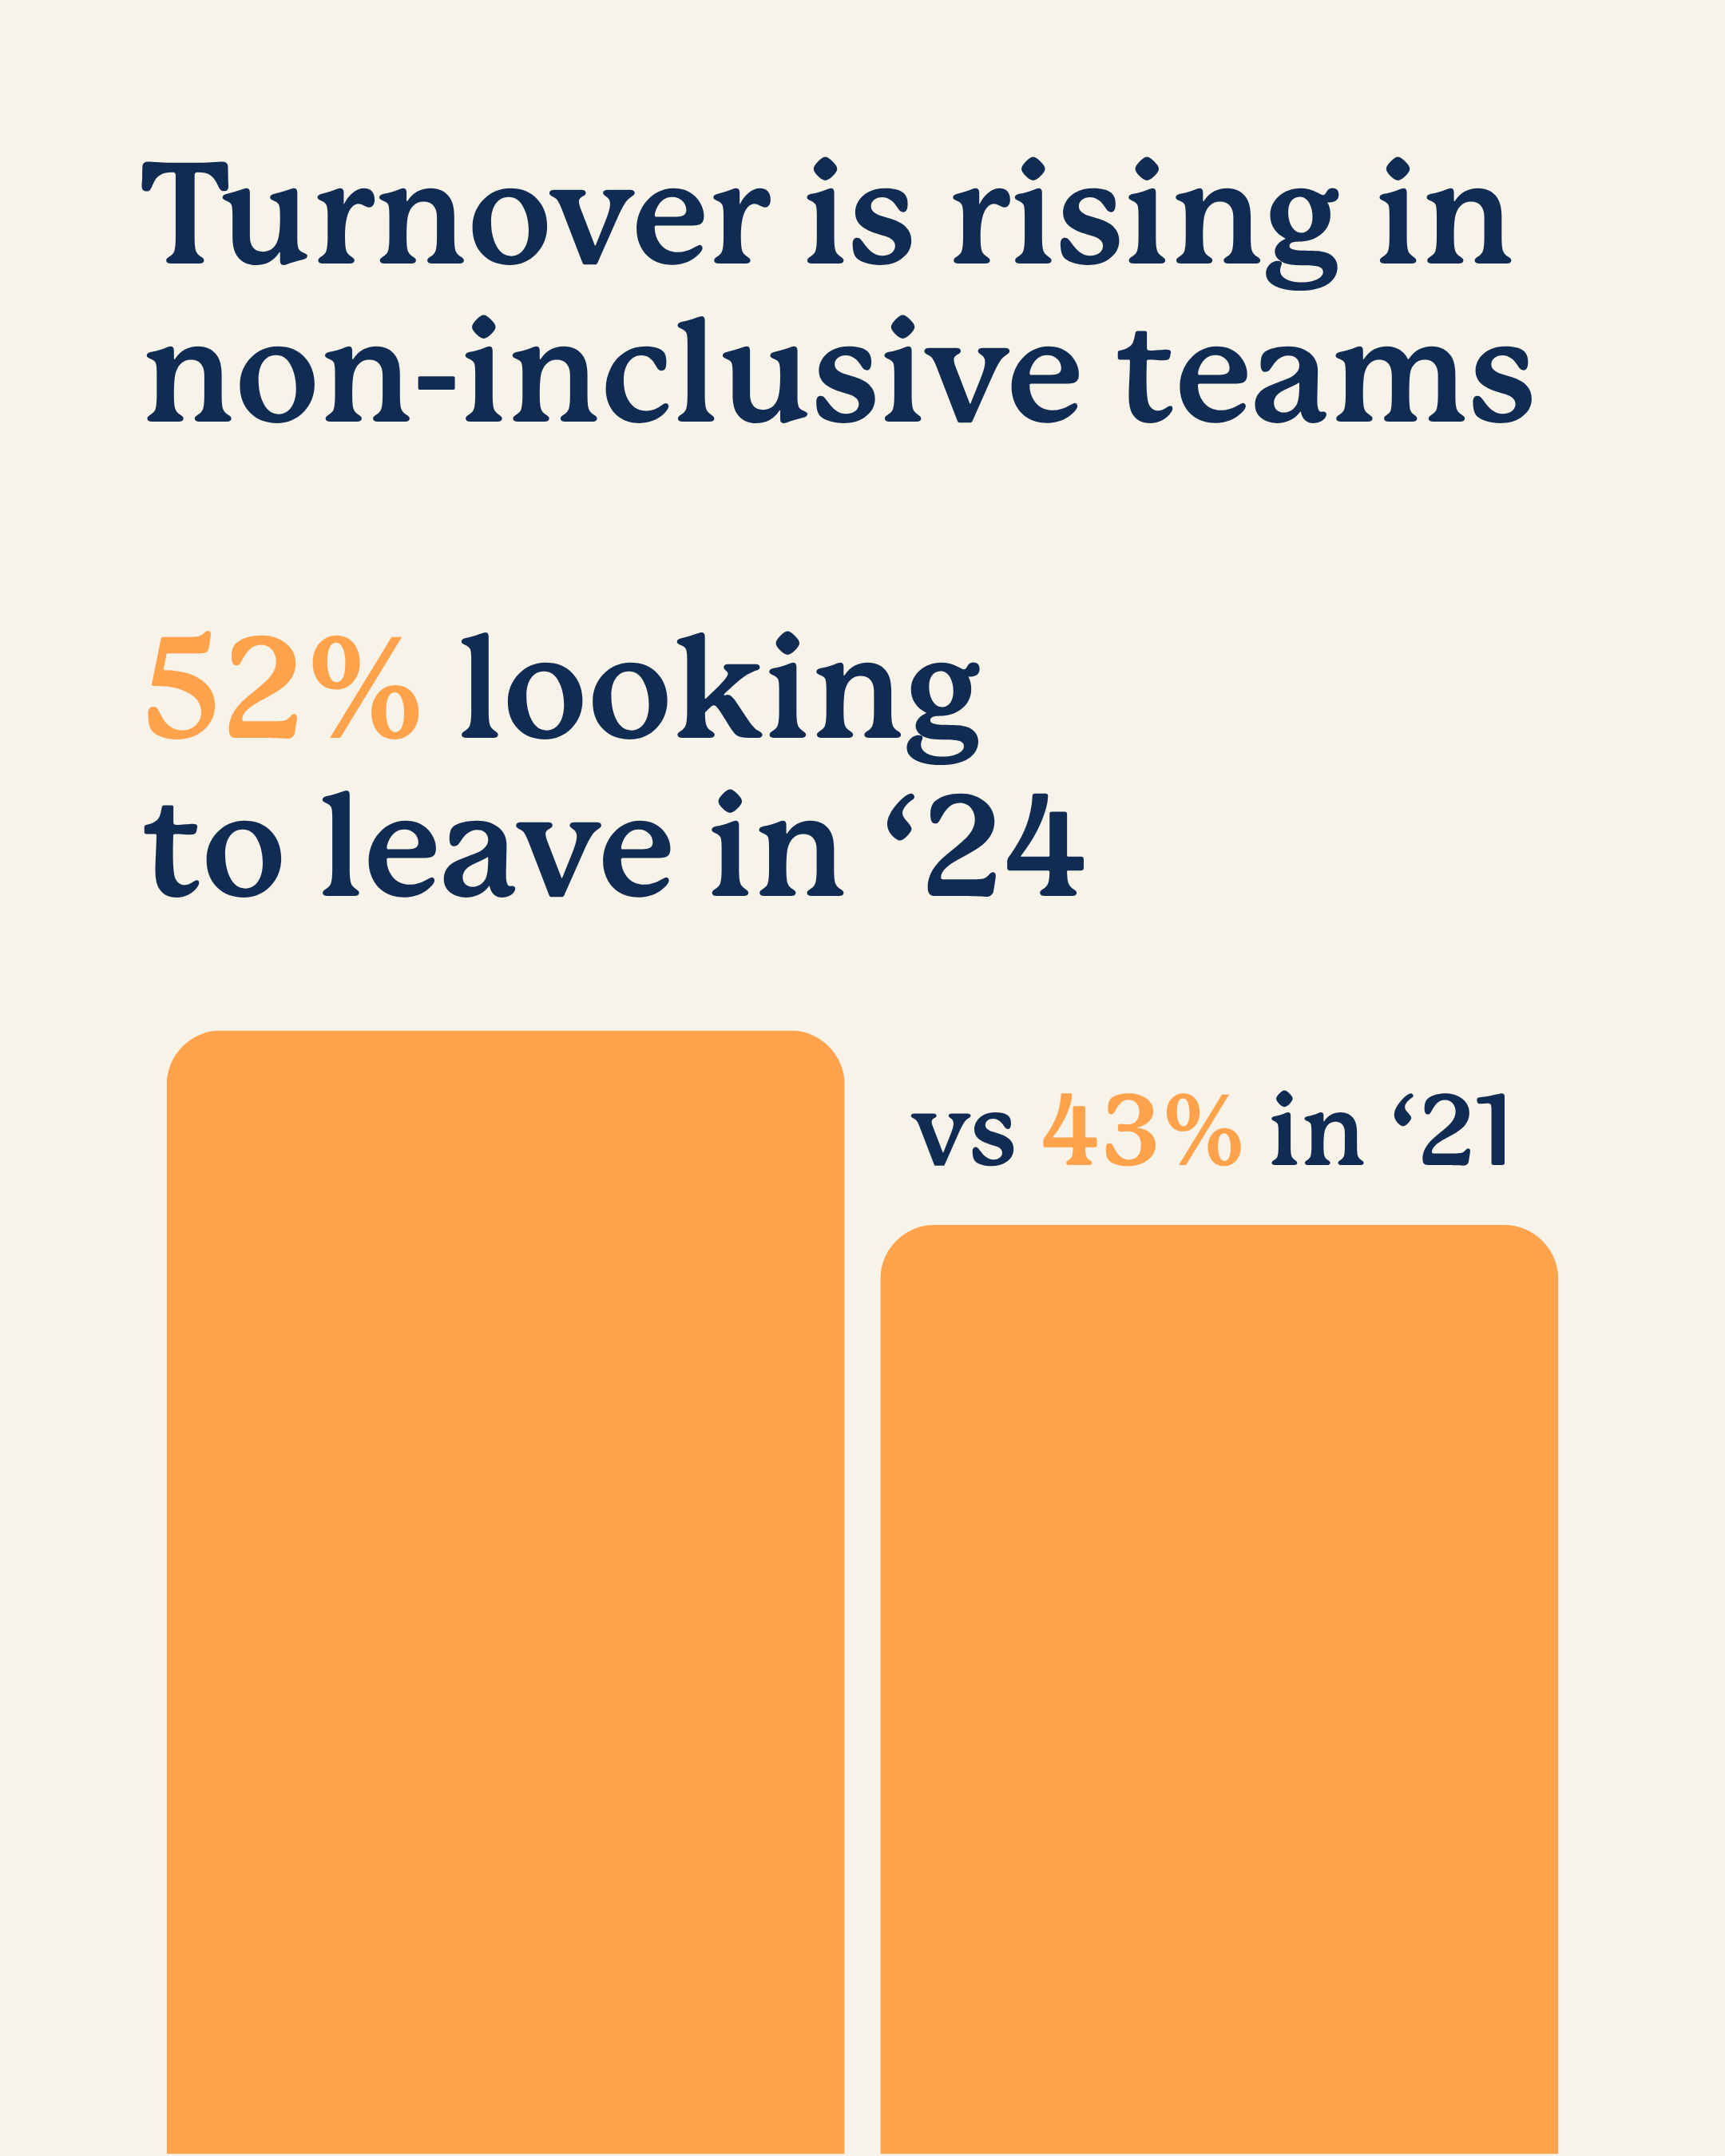
But in non-inclusive teams, satisfaction has dropped from 9% to just 4.5% — and 52% are now planning to leave.
Inclusion compounds. The longer you invest, the stronger the results.
3. Leadership sets the tone — but inclusion is everyone’s job.


SSSDLN data shows a clear pattern: when leaders actively support inclusion, teams thrive.
Teams with inclusive leadership are 5x more effective.
Reports of discrimination name a senior leader at a higher rate than the national average.
The spatial sector leads, with 80% of organisations taking D&I action — compared to 77% in space and 71% in surveying.
Inclusion isn’t a side project — it’s a leadership responsibility and a business advantage.
4. Culture is how inclusion shows up — or doesn’t.


Inclusion isn’t just a policy — it’s how people work together every day.
In inclusive teams, 54% say they always seek new ideas and ways to solve problems.
59% say they always work well together.
61% consistently deliver excellent client service.
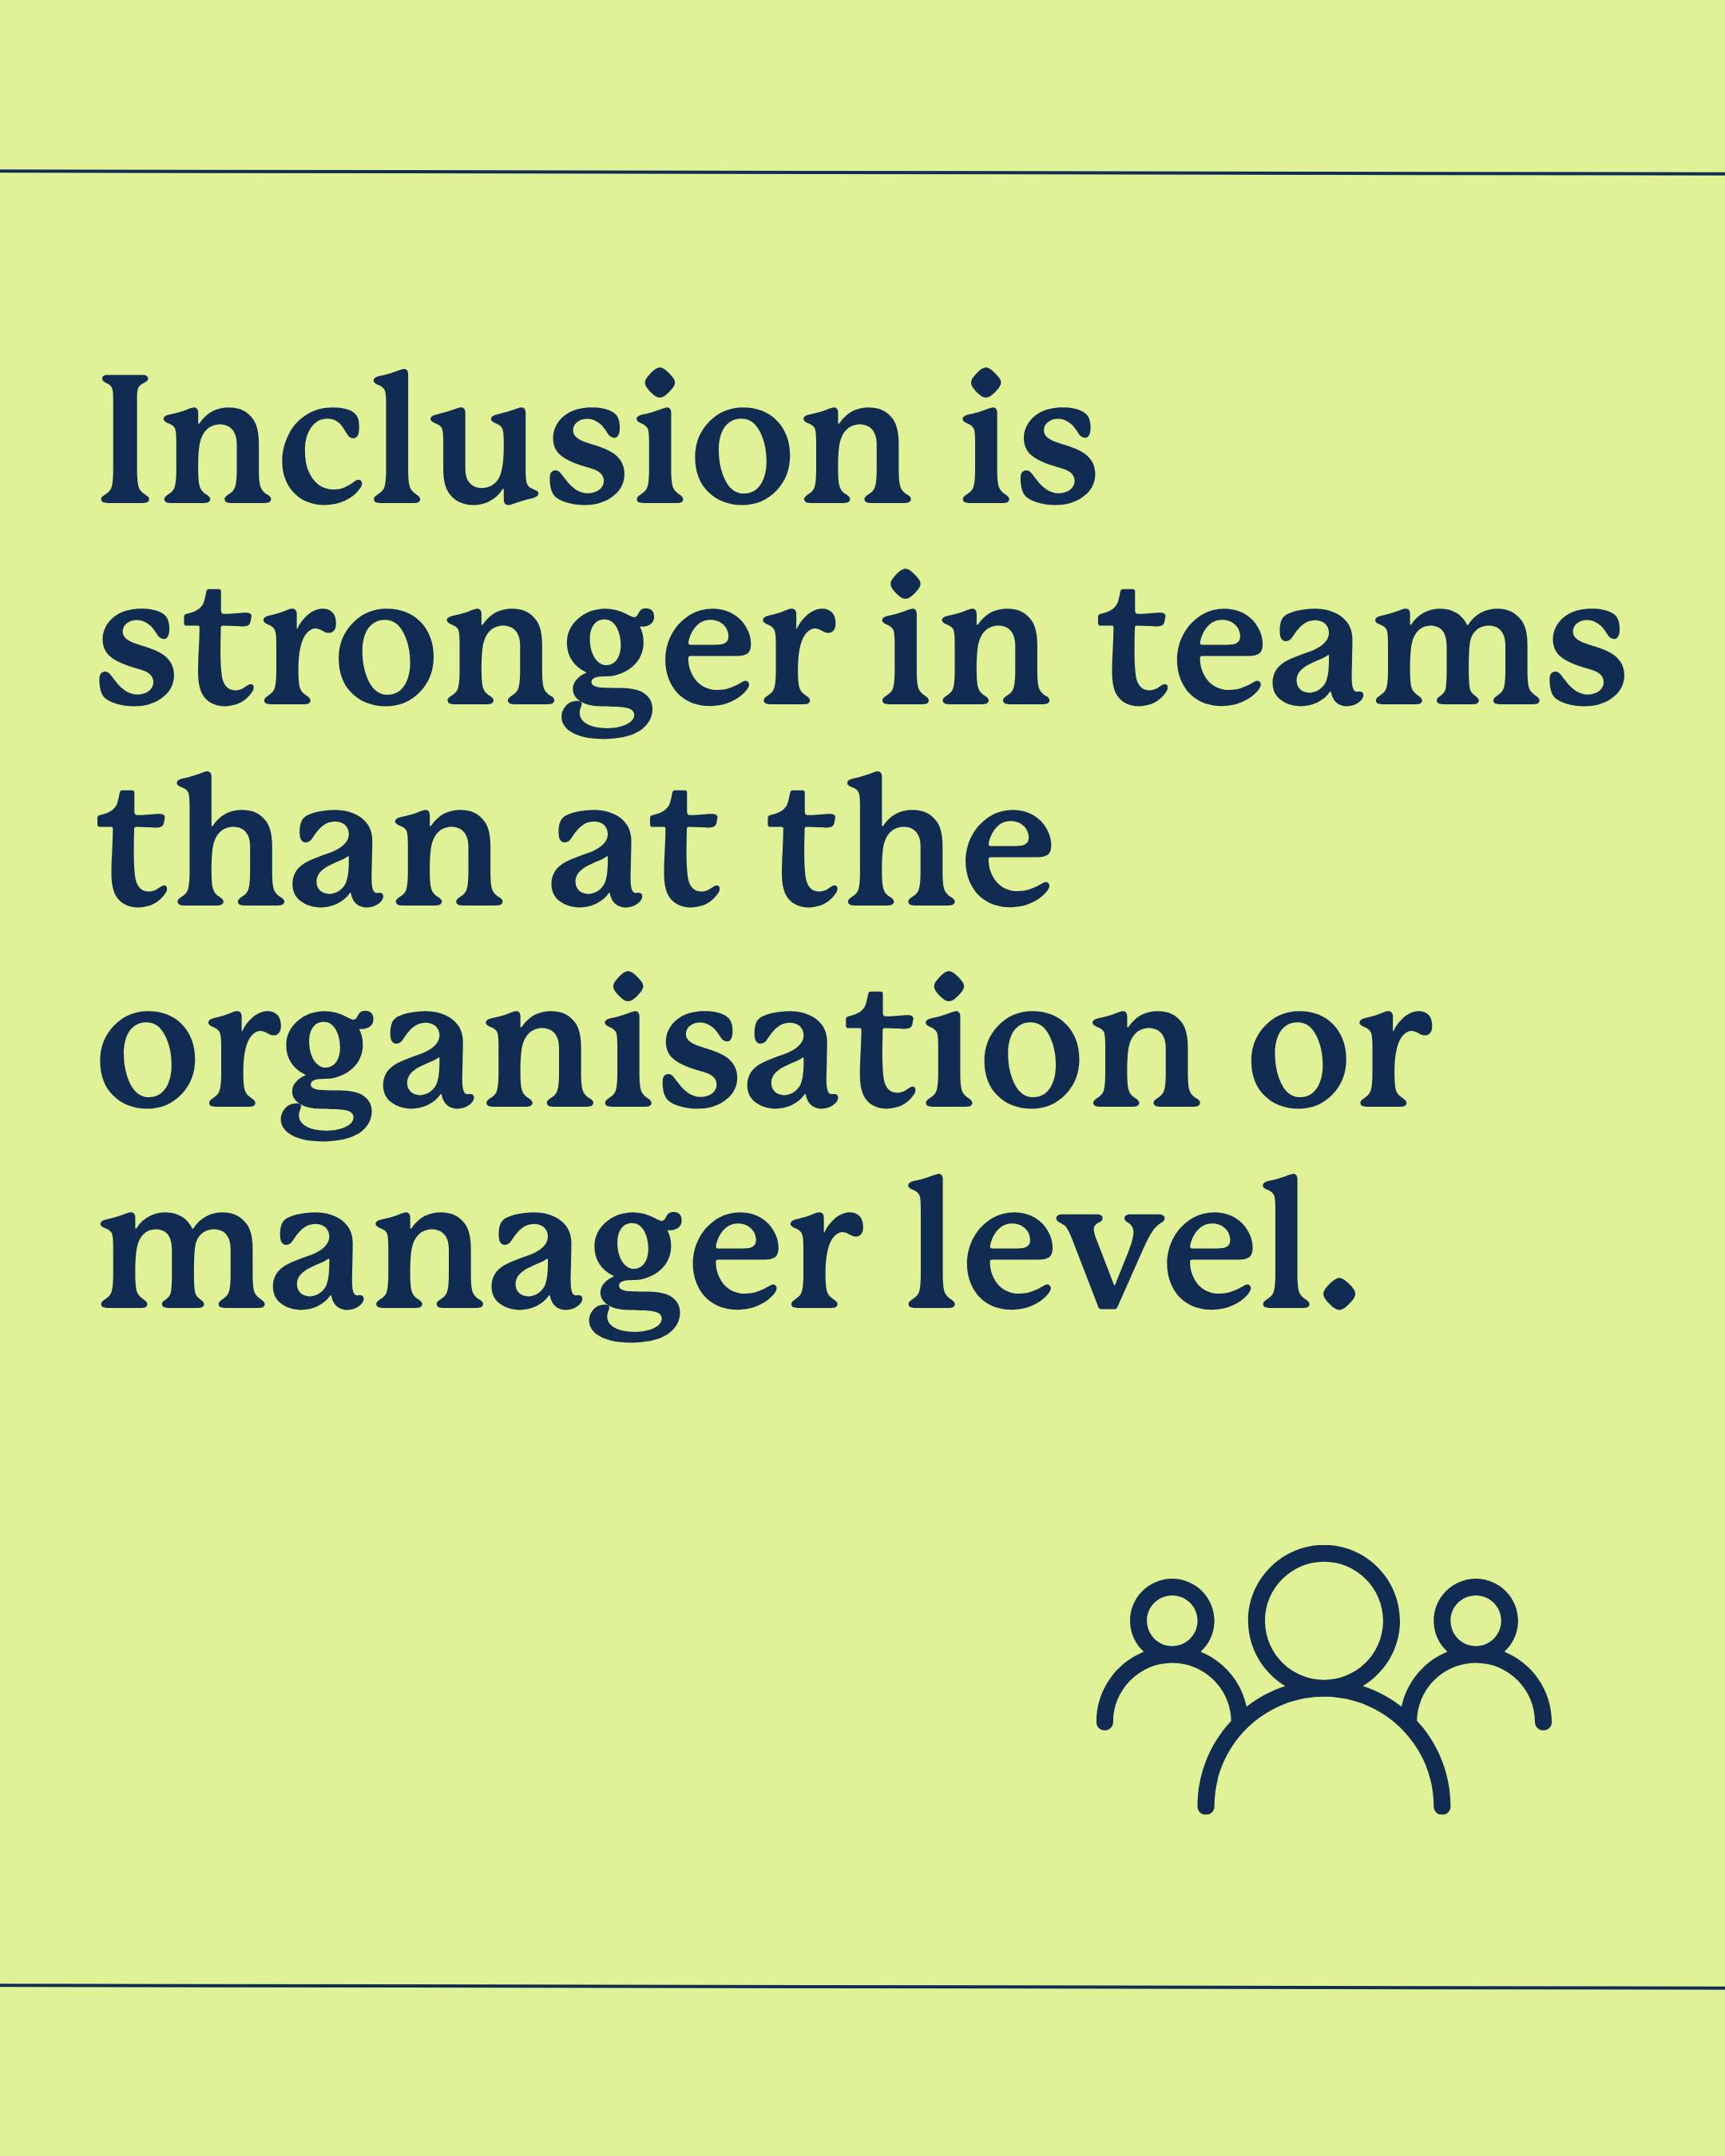
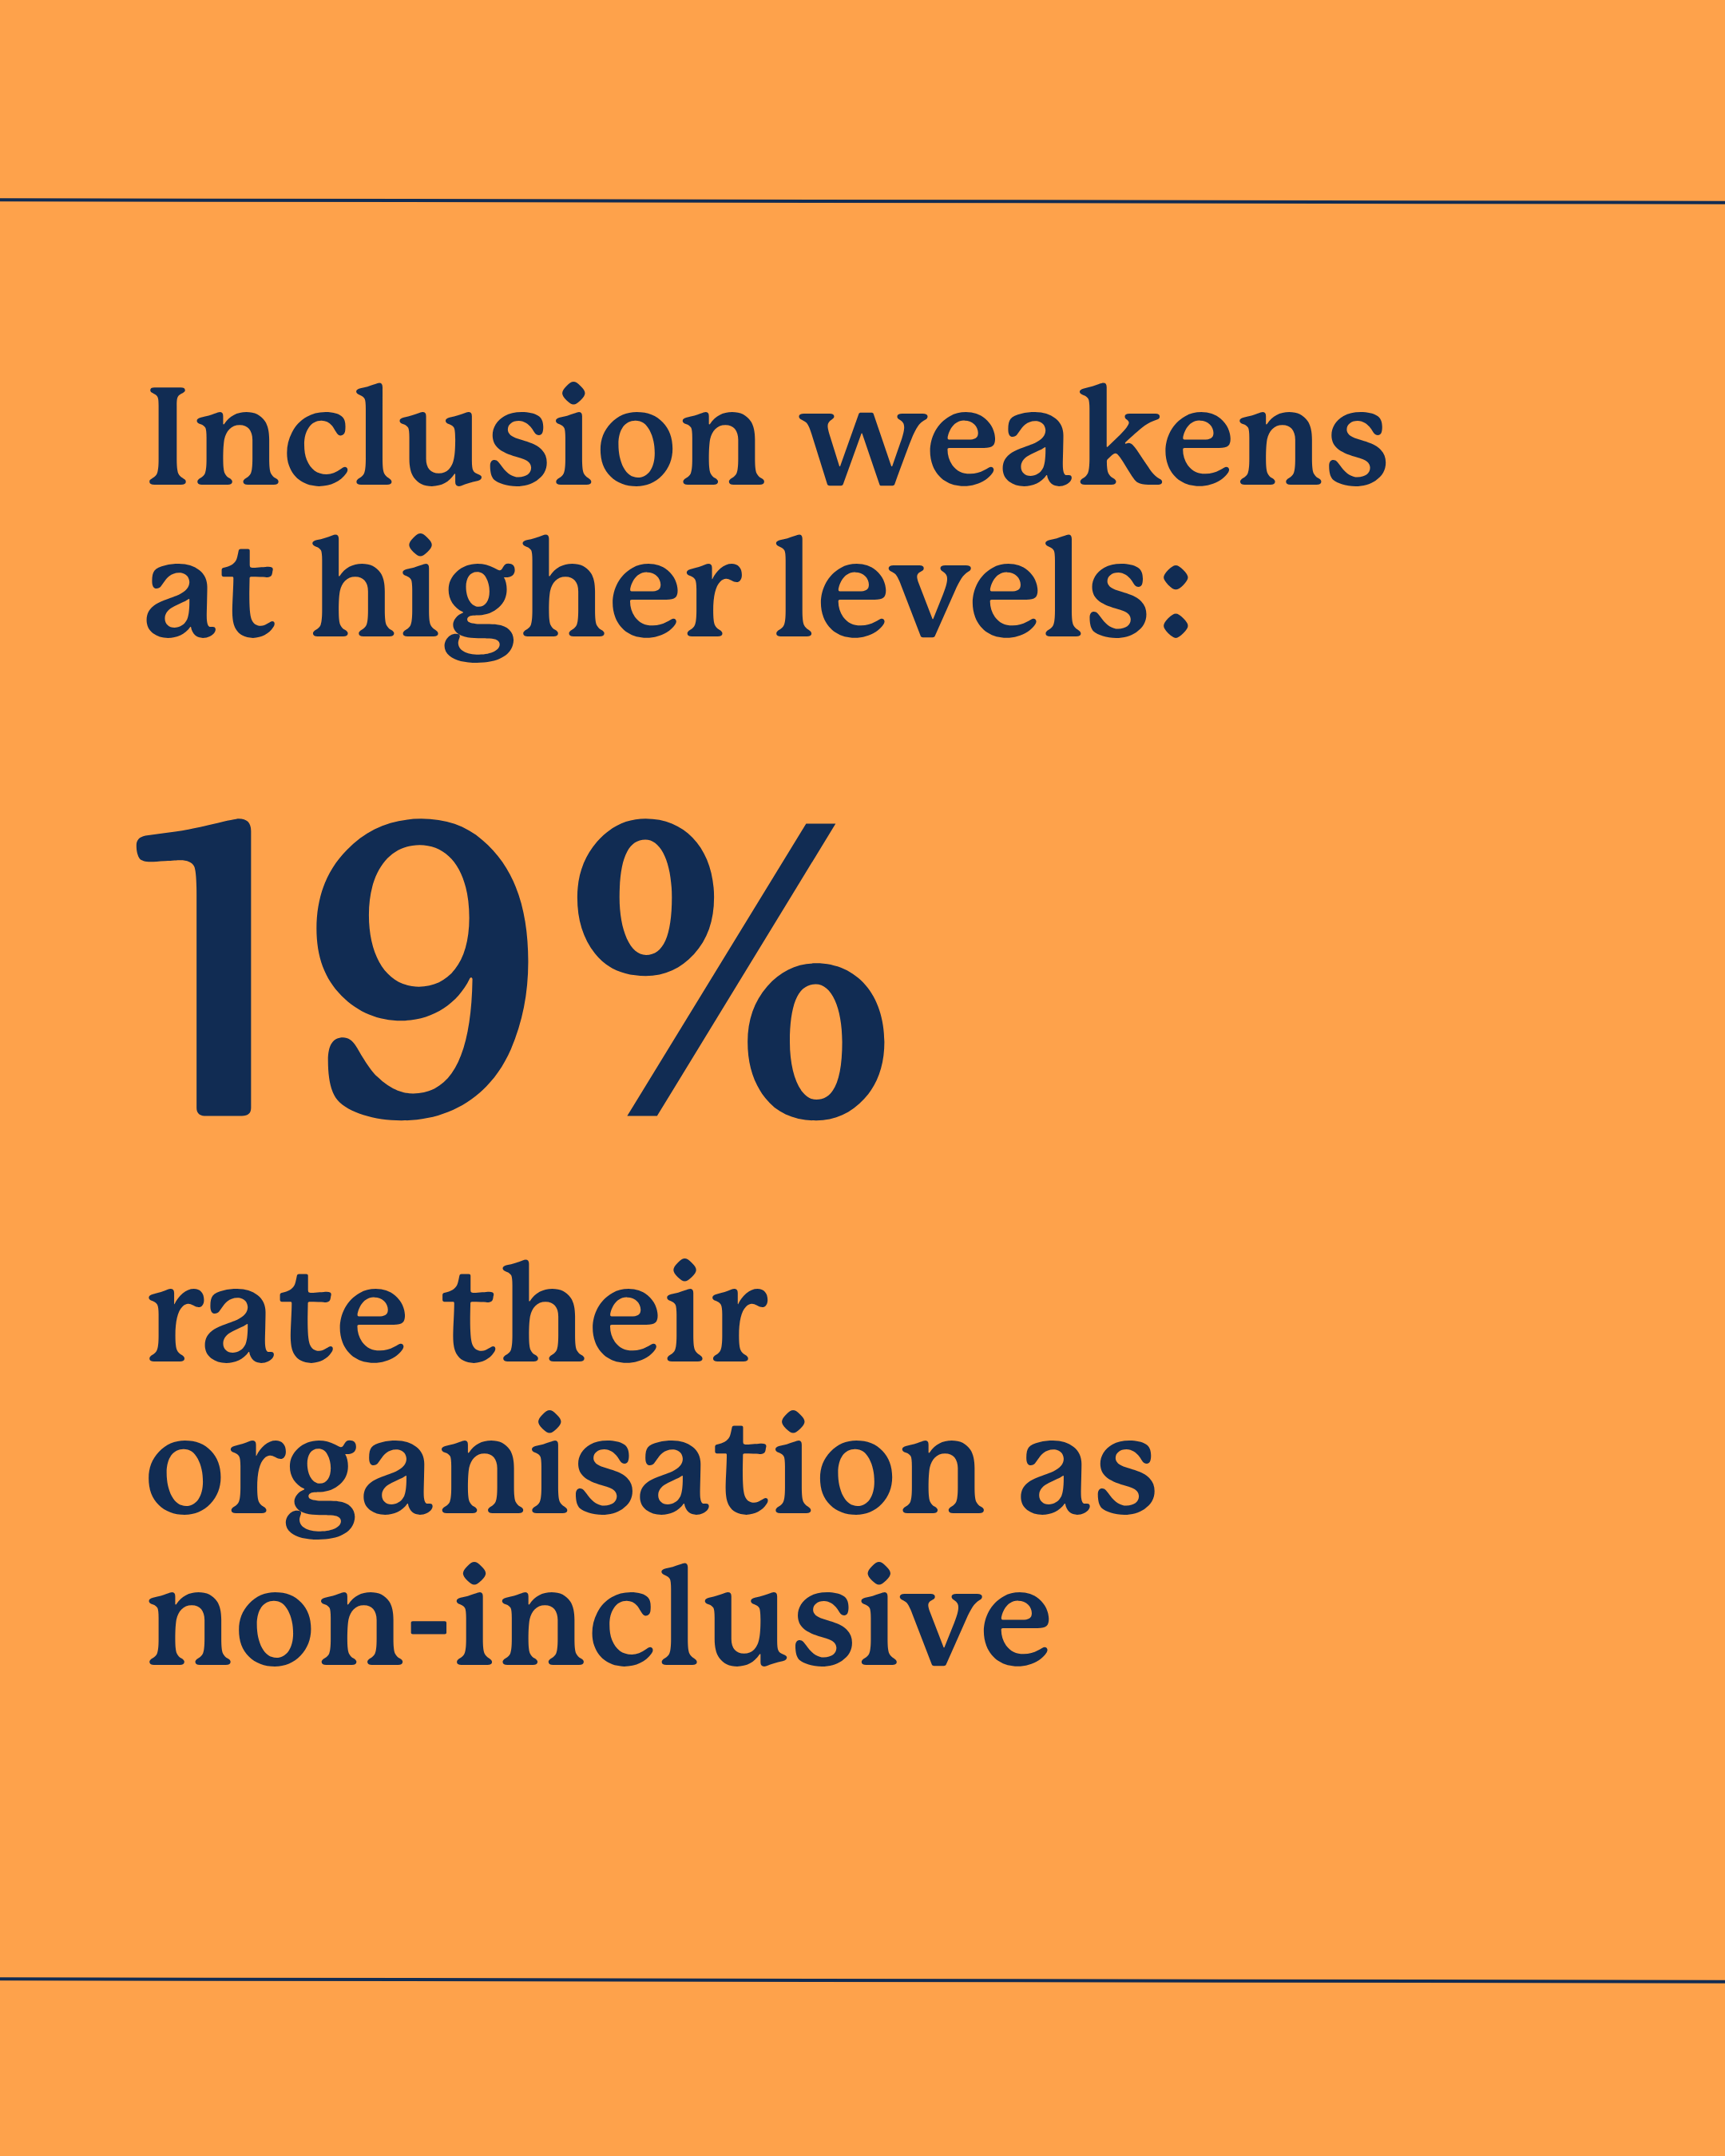
But the further you move from the team level, the weaker inclusion becomes:
19% say their organisation is non-inclusive.
18% say that of their manager.
Just 11% say the same of their team.
Culture builds from the ground up — but it needs to be reinforced from the top down.
5. Are we all getting a fair shot at career progression?

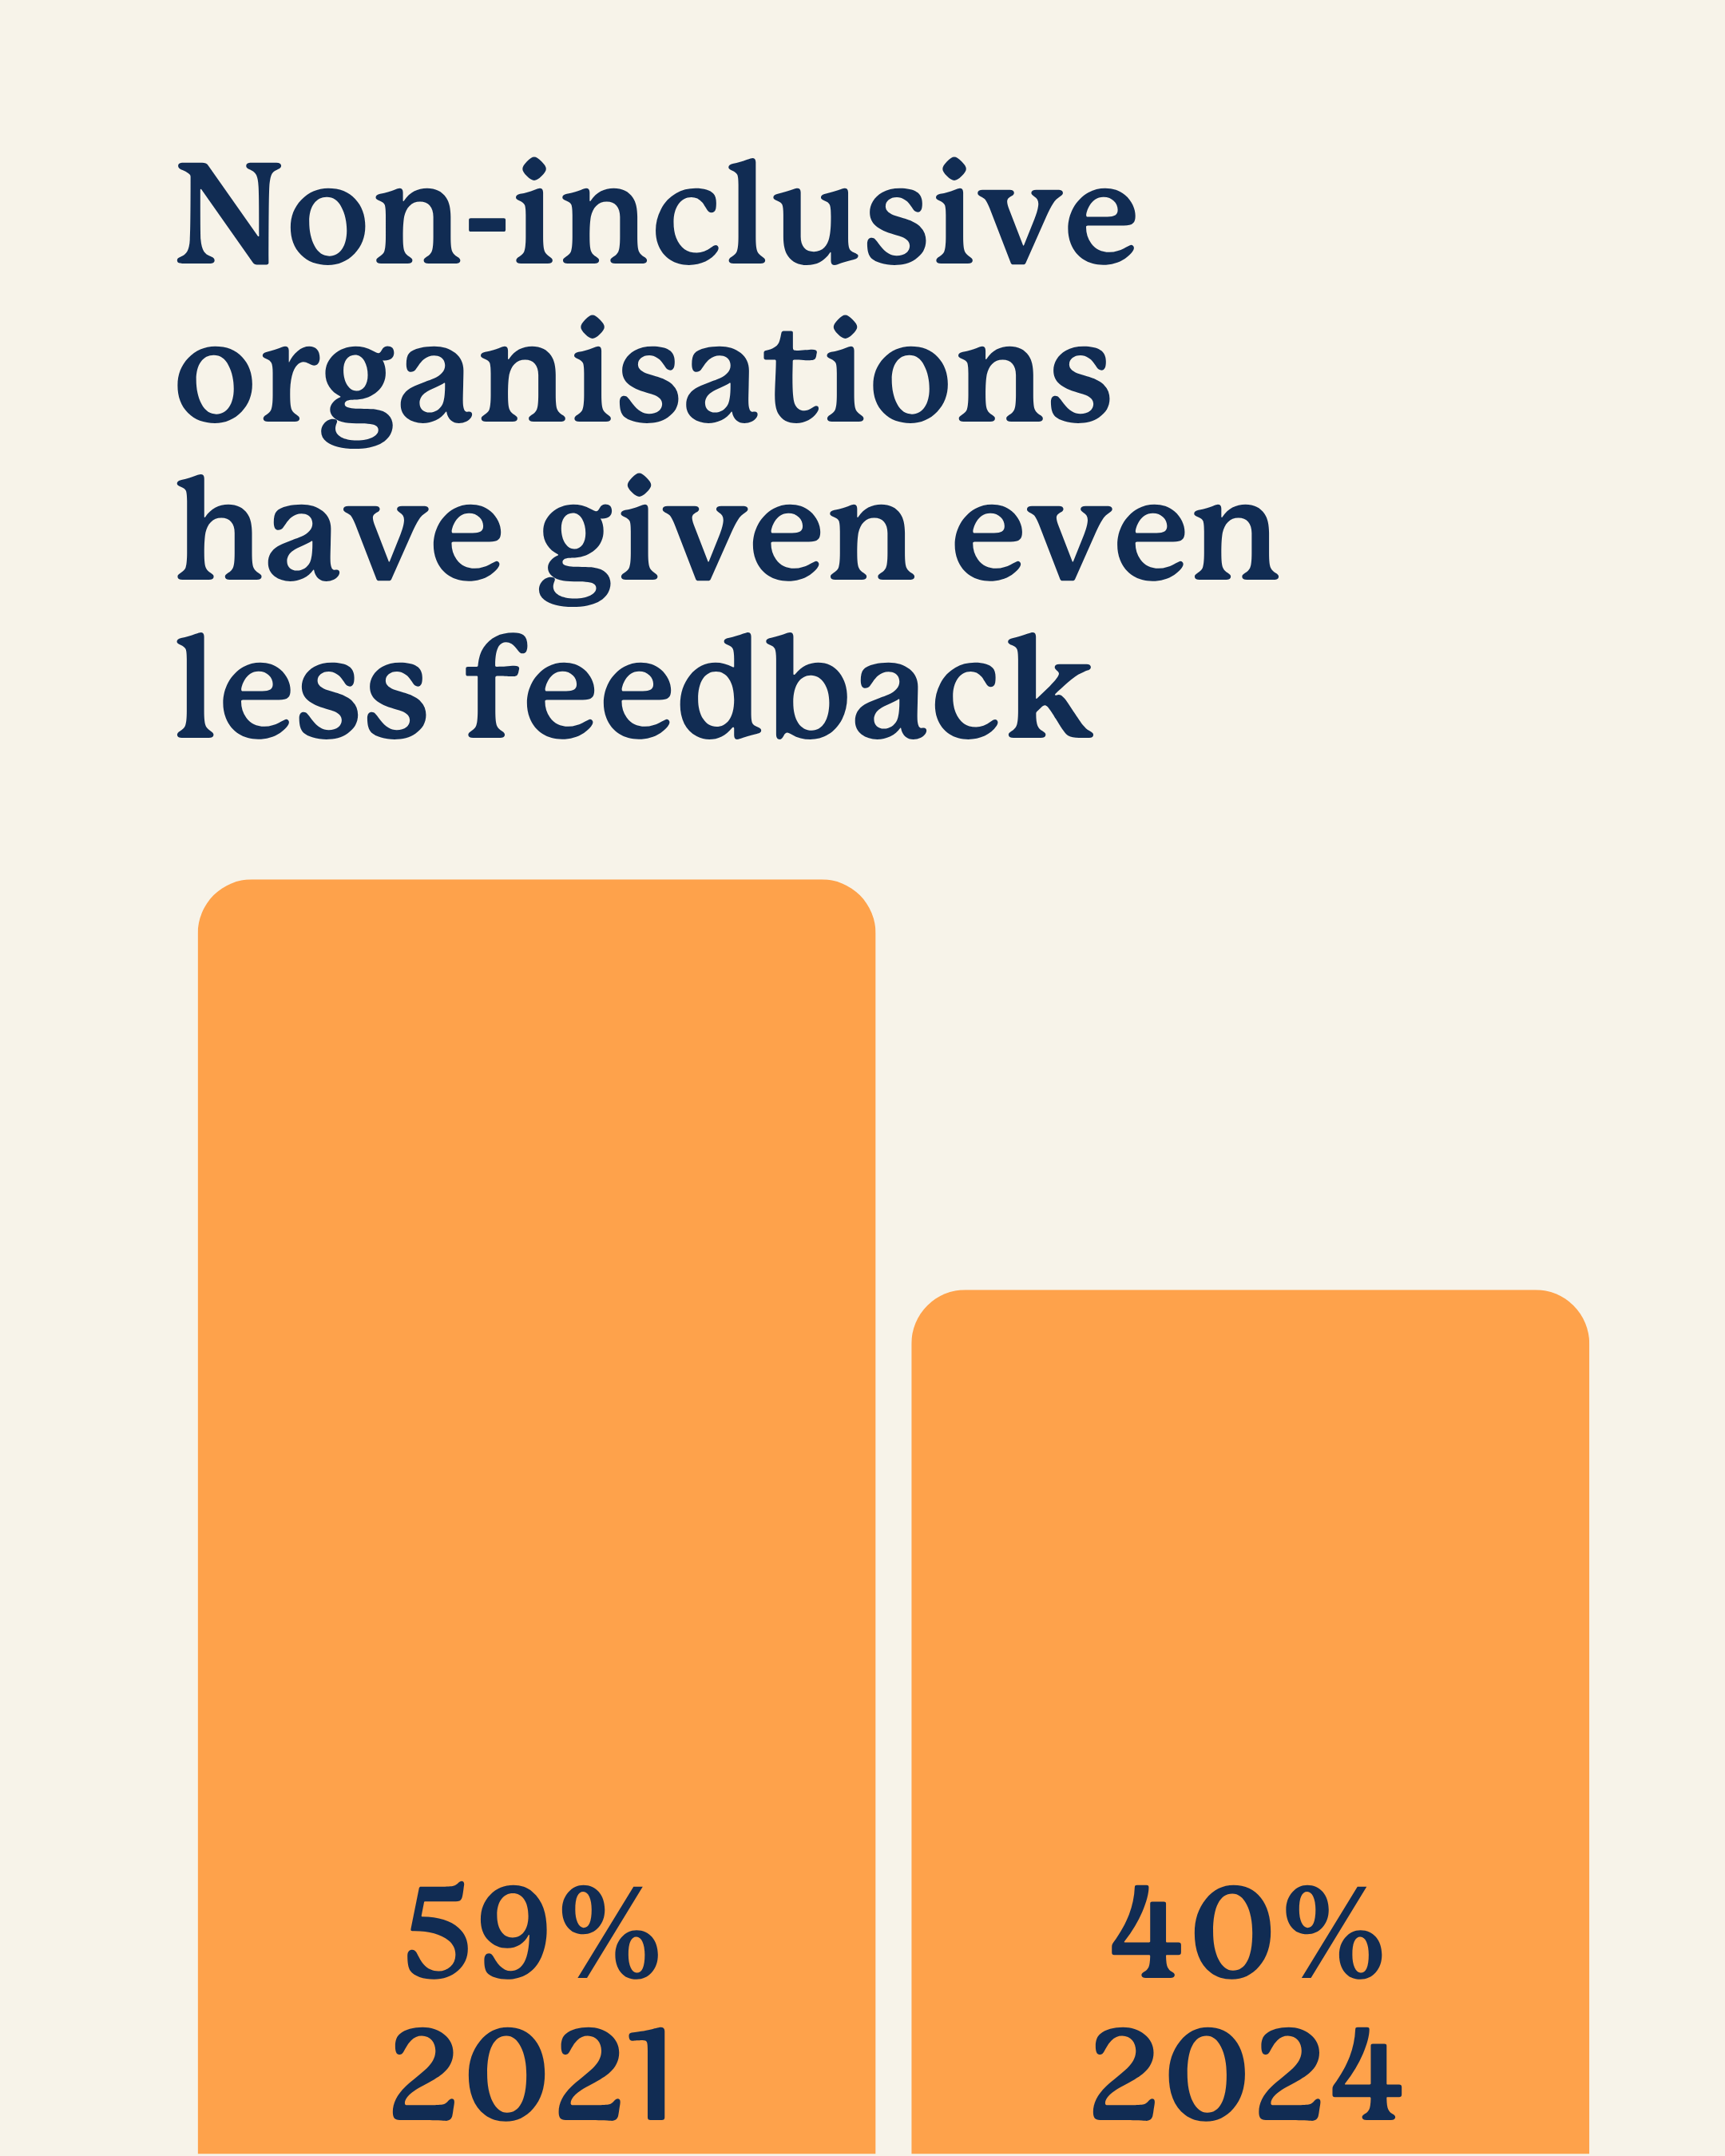

Feedback fuels growth — and inclusion makes that feedback more likely and more useful.
87% of people in inclusive teams received helpful performance feedback.
In non-inclusive teams, that drops to just 33%.
And in non-inclusive organisations, that number is falling — down nearly 20% since 2021.
This isn’t just about promotions. It’s about whether people are being supported to grow.
If you’re in a position to help — consider mentoring someone who’s being overlooked.
6. Gender diversity is improving — but far from equal.
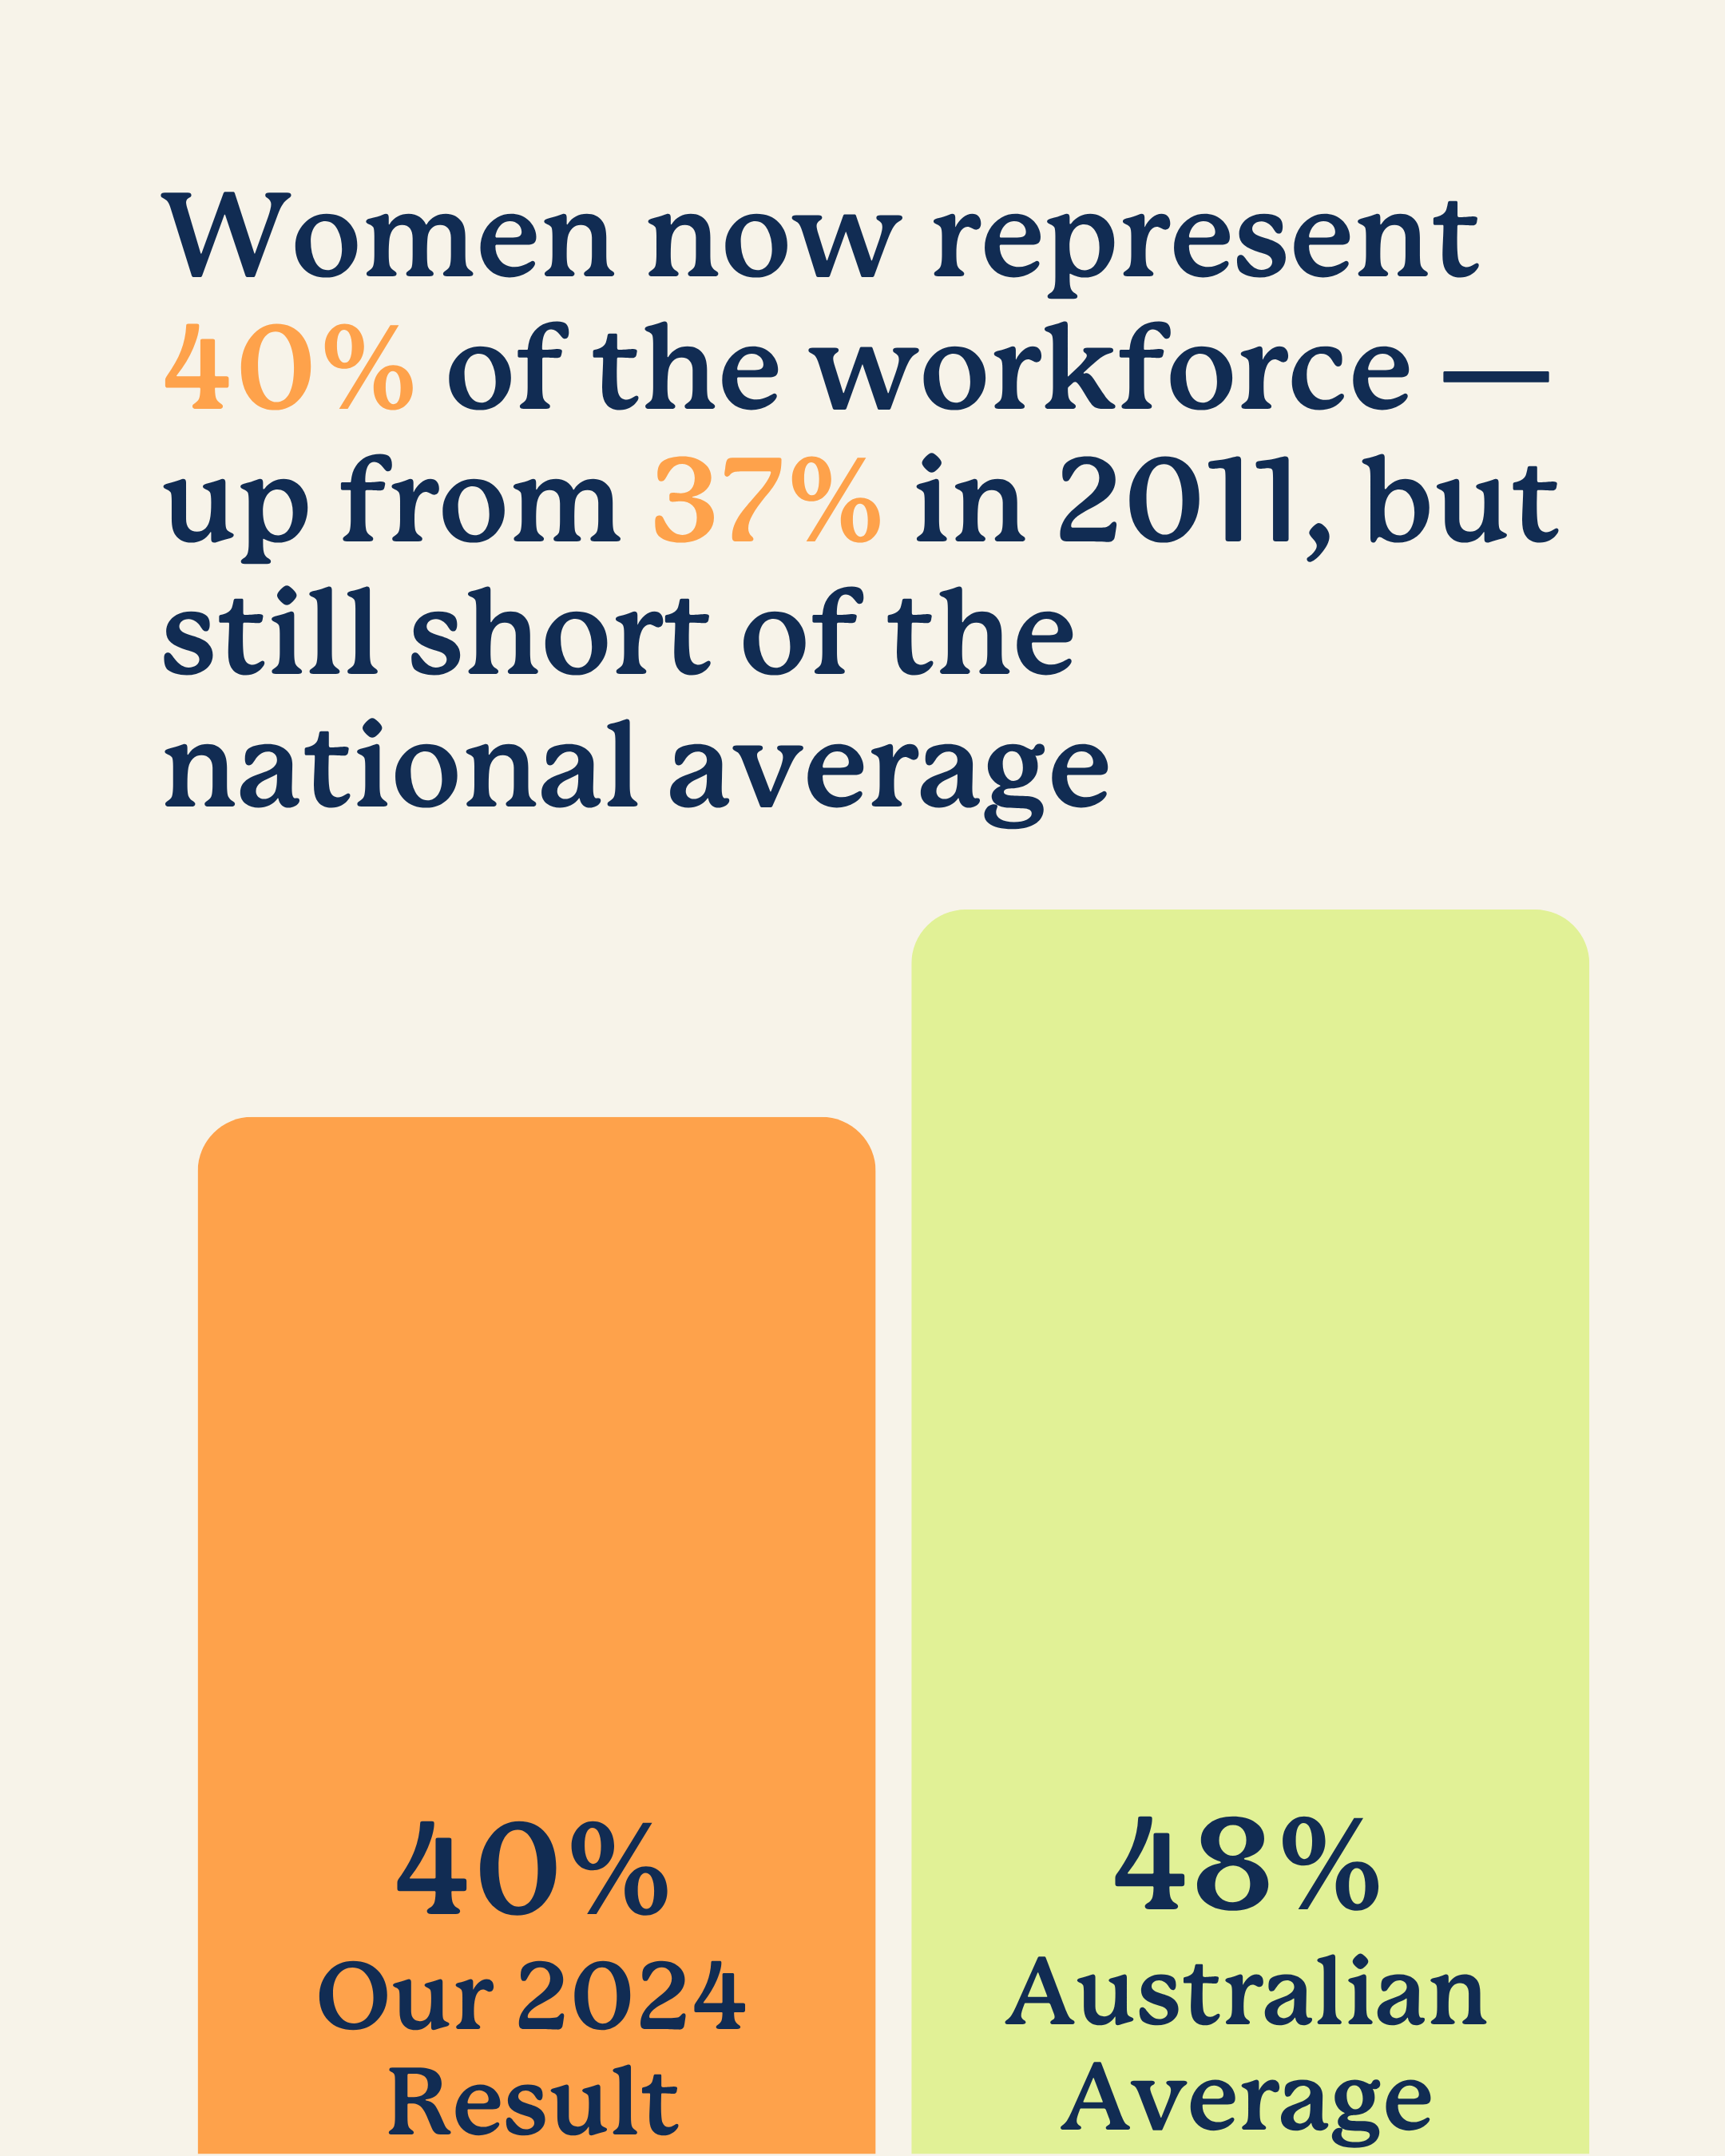


Since 2011, representation of women in our sectors has grown from 37% to 40%. That’s progress — but still short of the national average (48%).
Across sectors, the gap is even wider:
Surveying: 23%
Spatial: 47.3%
Space: 48.7%
Representation matters. It shapes who gets heard, who gets promoted, and who sees a future in the field.
How do your numbers compare?
7. This shouldn’t be happening — and it still is.


For the first time, the SSSDLN survey asked directly about experiences of discrimination and harassment. The results are sobering.
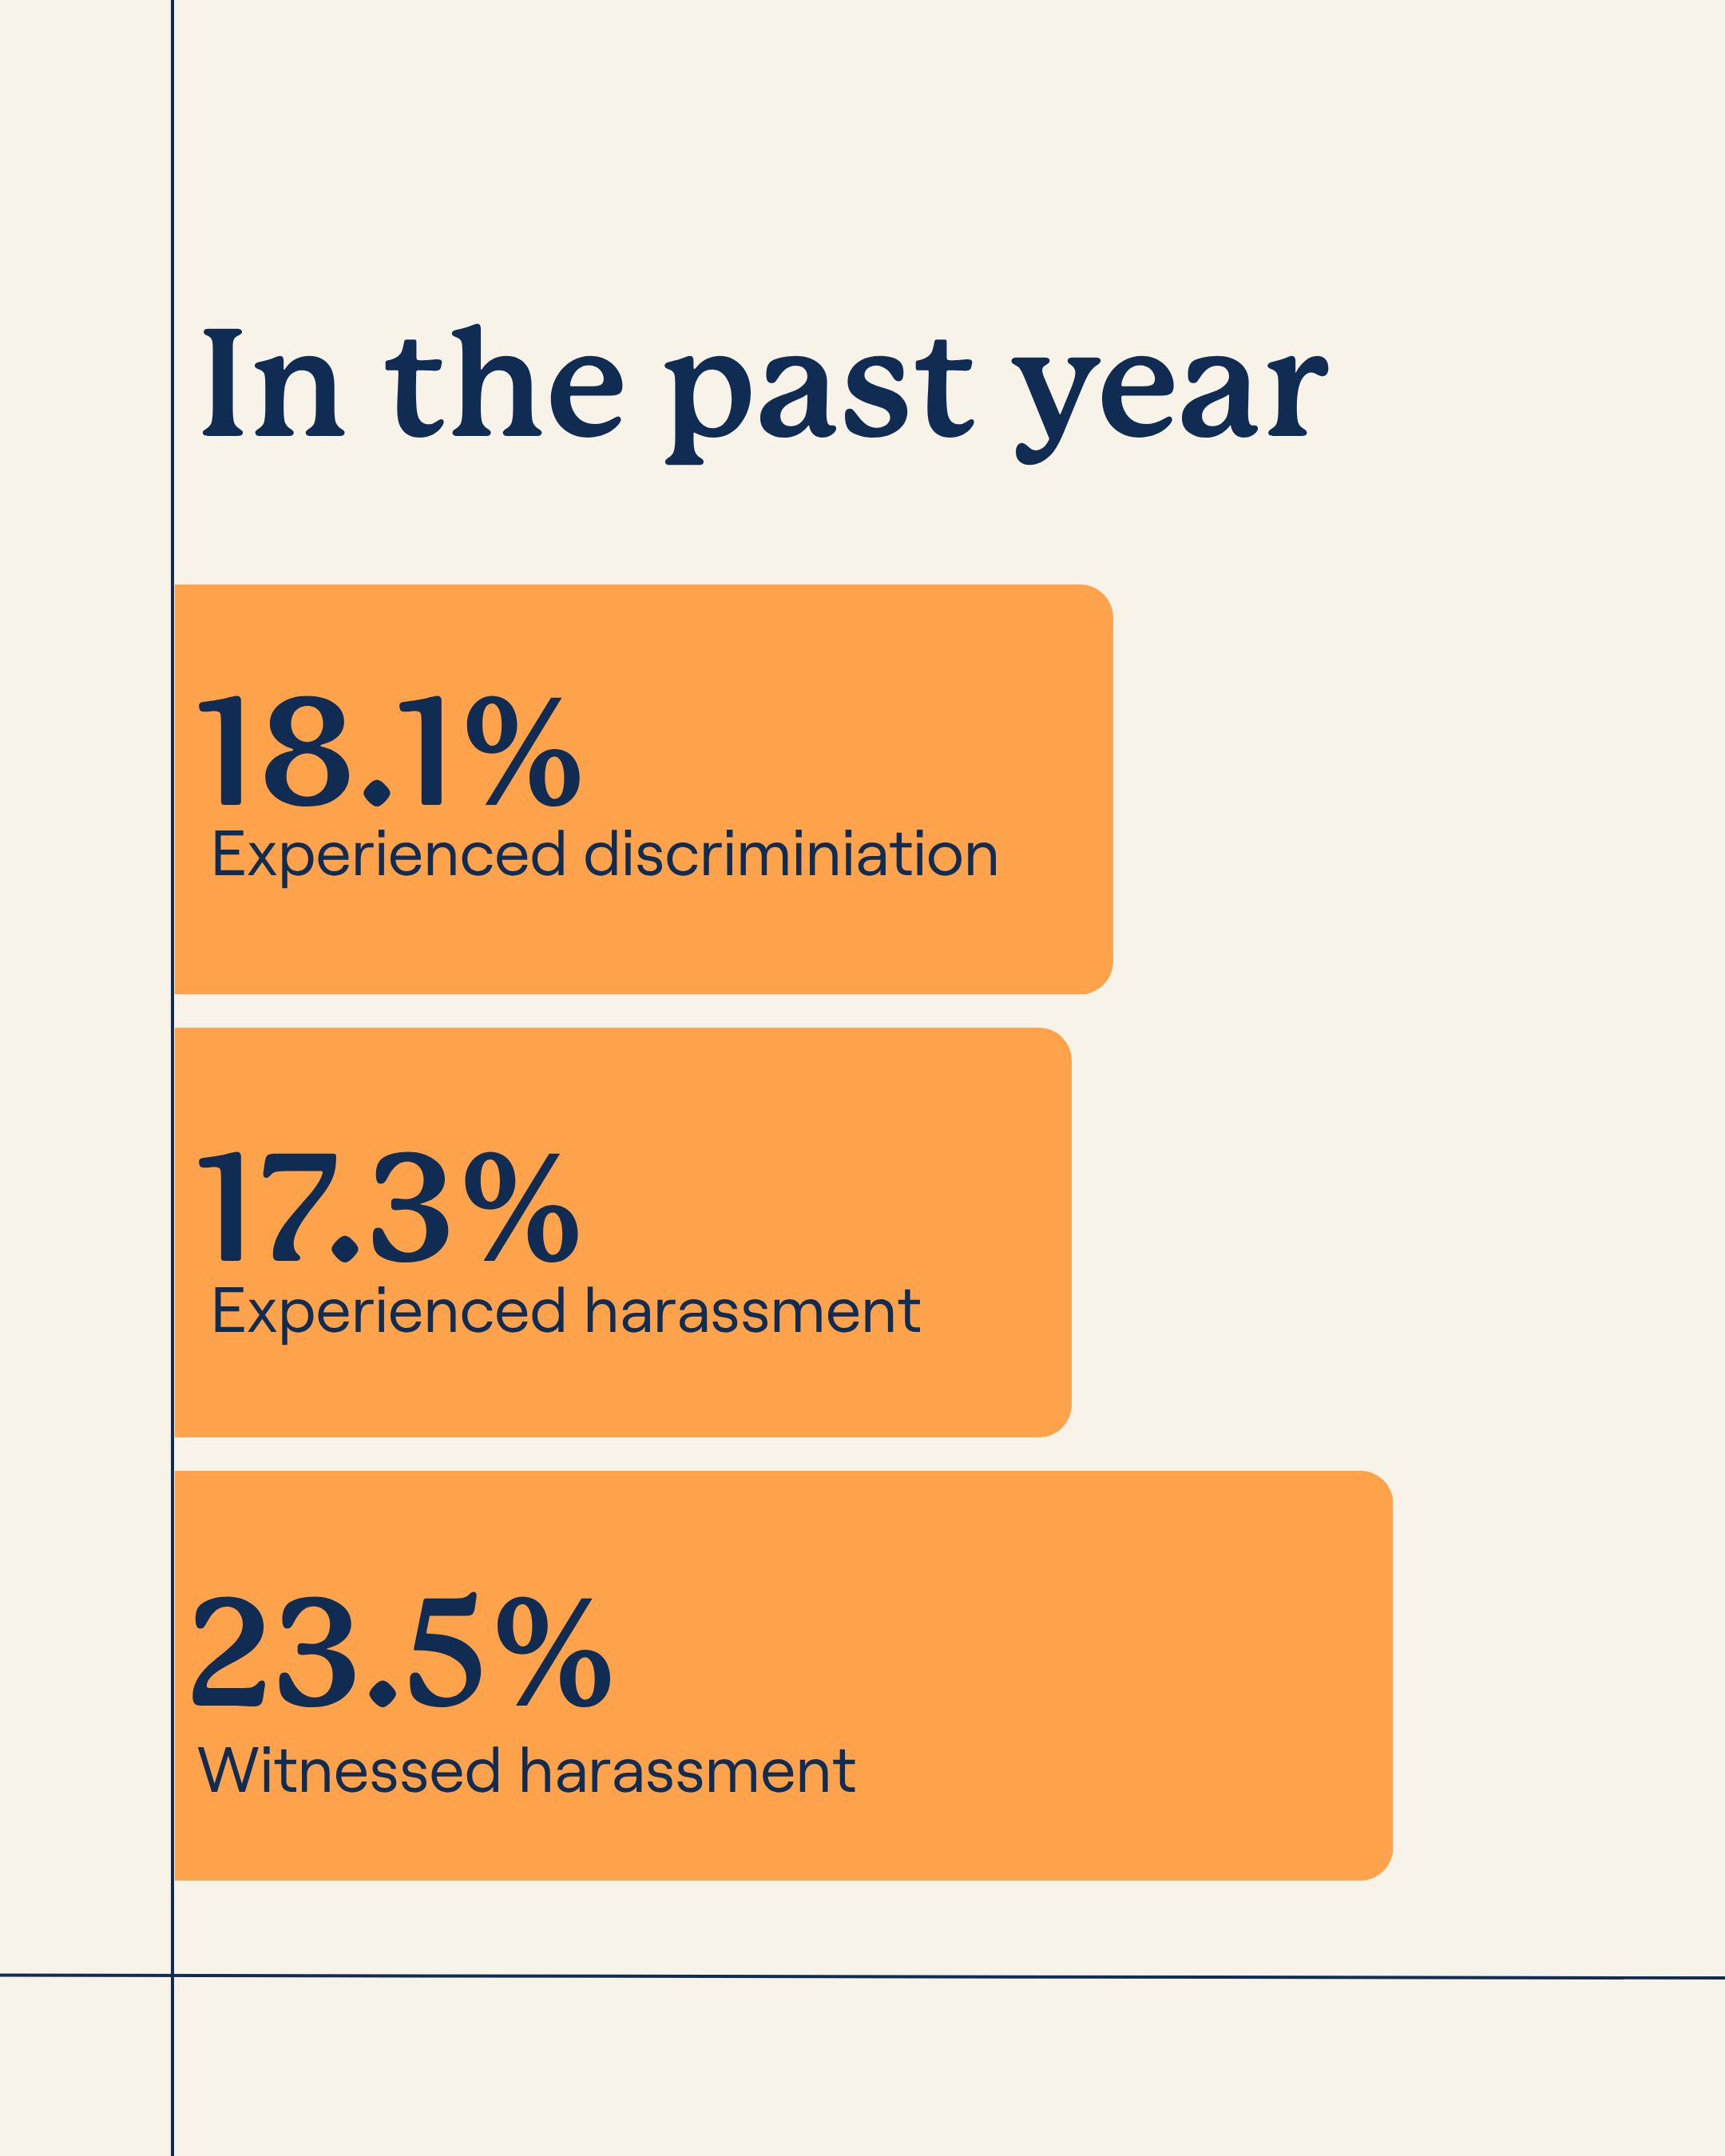
In the past 12 months:
18.1% experienced discrimination.
17.3% experienced harassment.
23.5% witnessed harassment.
These rates are still below national averages — but they’re rising. And in the space sector, 1 in 3 have witnessed harassment.
Inclusive teams report significantly fewer incidents. That’s not a coincidence. It’s a call to action.
8. Let’s not leave anyone behind.


Our sector is becoming more visibly diverse — but inclusion still isn’t reaching everyone.
Since 2021:
Representation of people with disability has more than doubled (now 18.7%).
LGBTIQ+ participation has risen to 14.6%.
Young people are better represented, but still below national averages.
Exclusion is down compared to national rates — but 1 in 4 people still report being excluded based on identity.
Representation is only the start. Inclusion means listening, sharing power, and making space for every voice.
9. Inclusion isn’t luck — it’s built.


The data is clear: inclusion transforms workplaces.
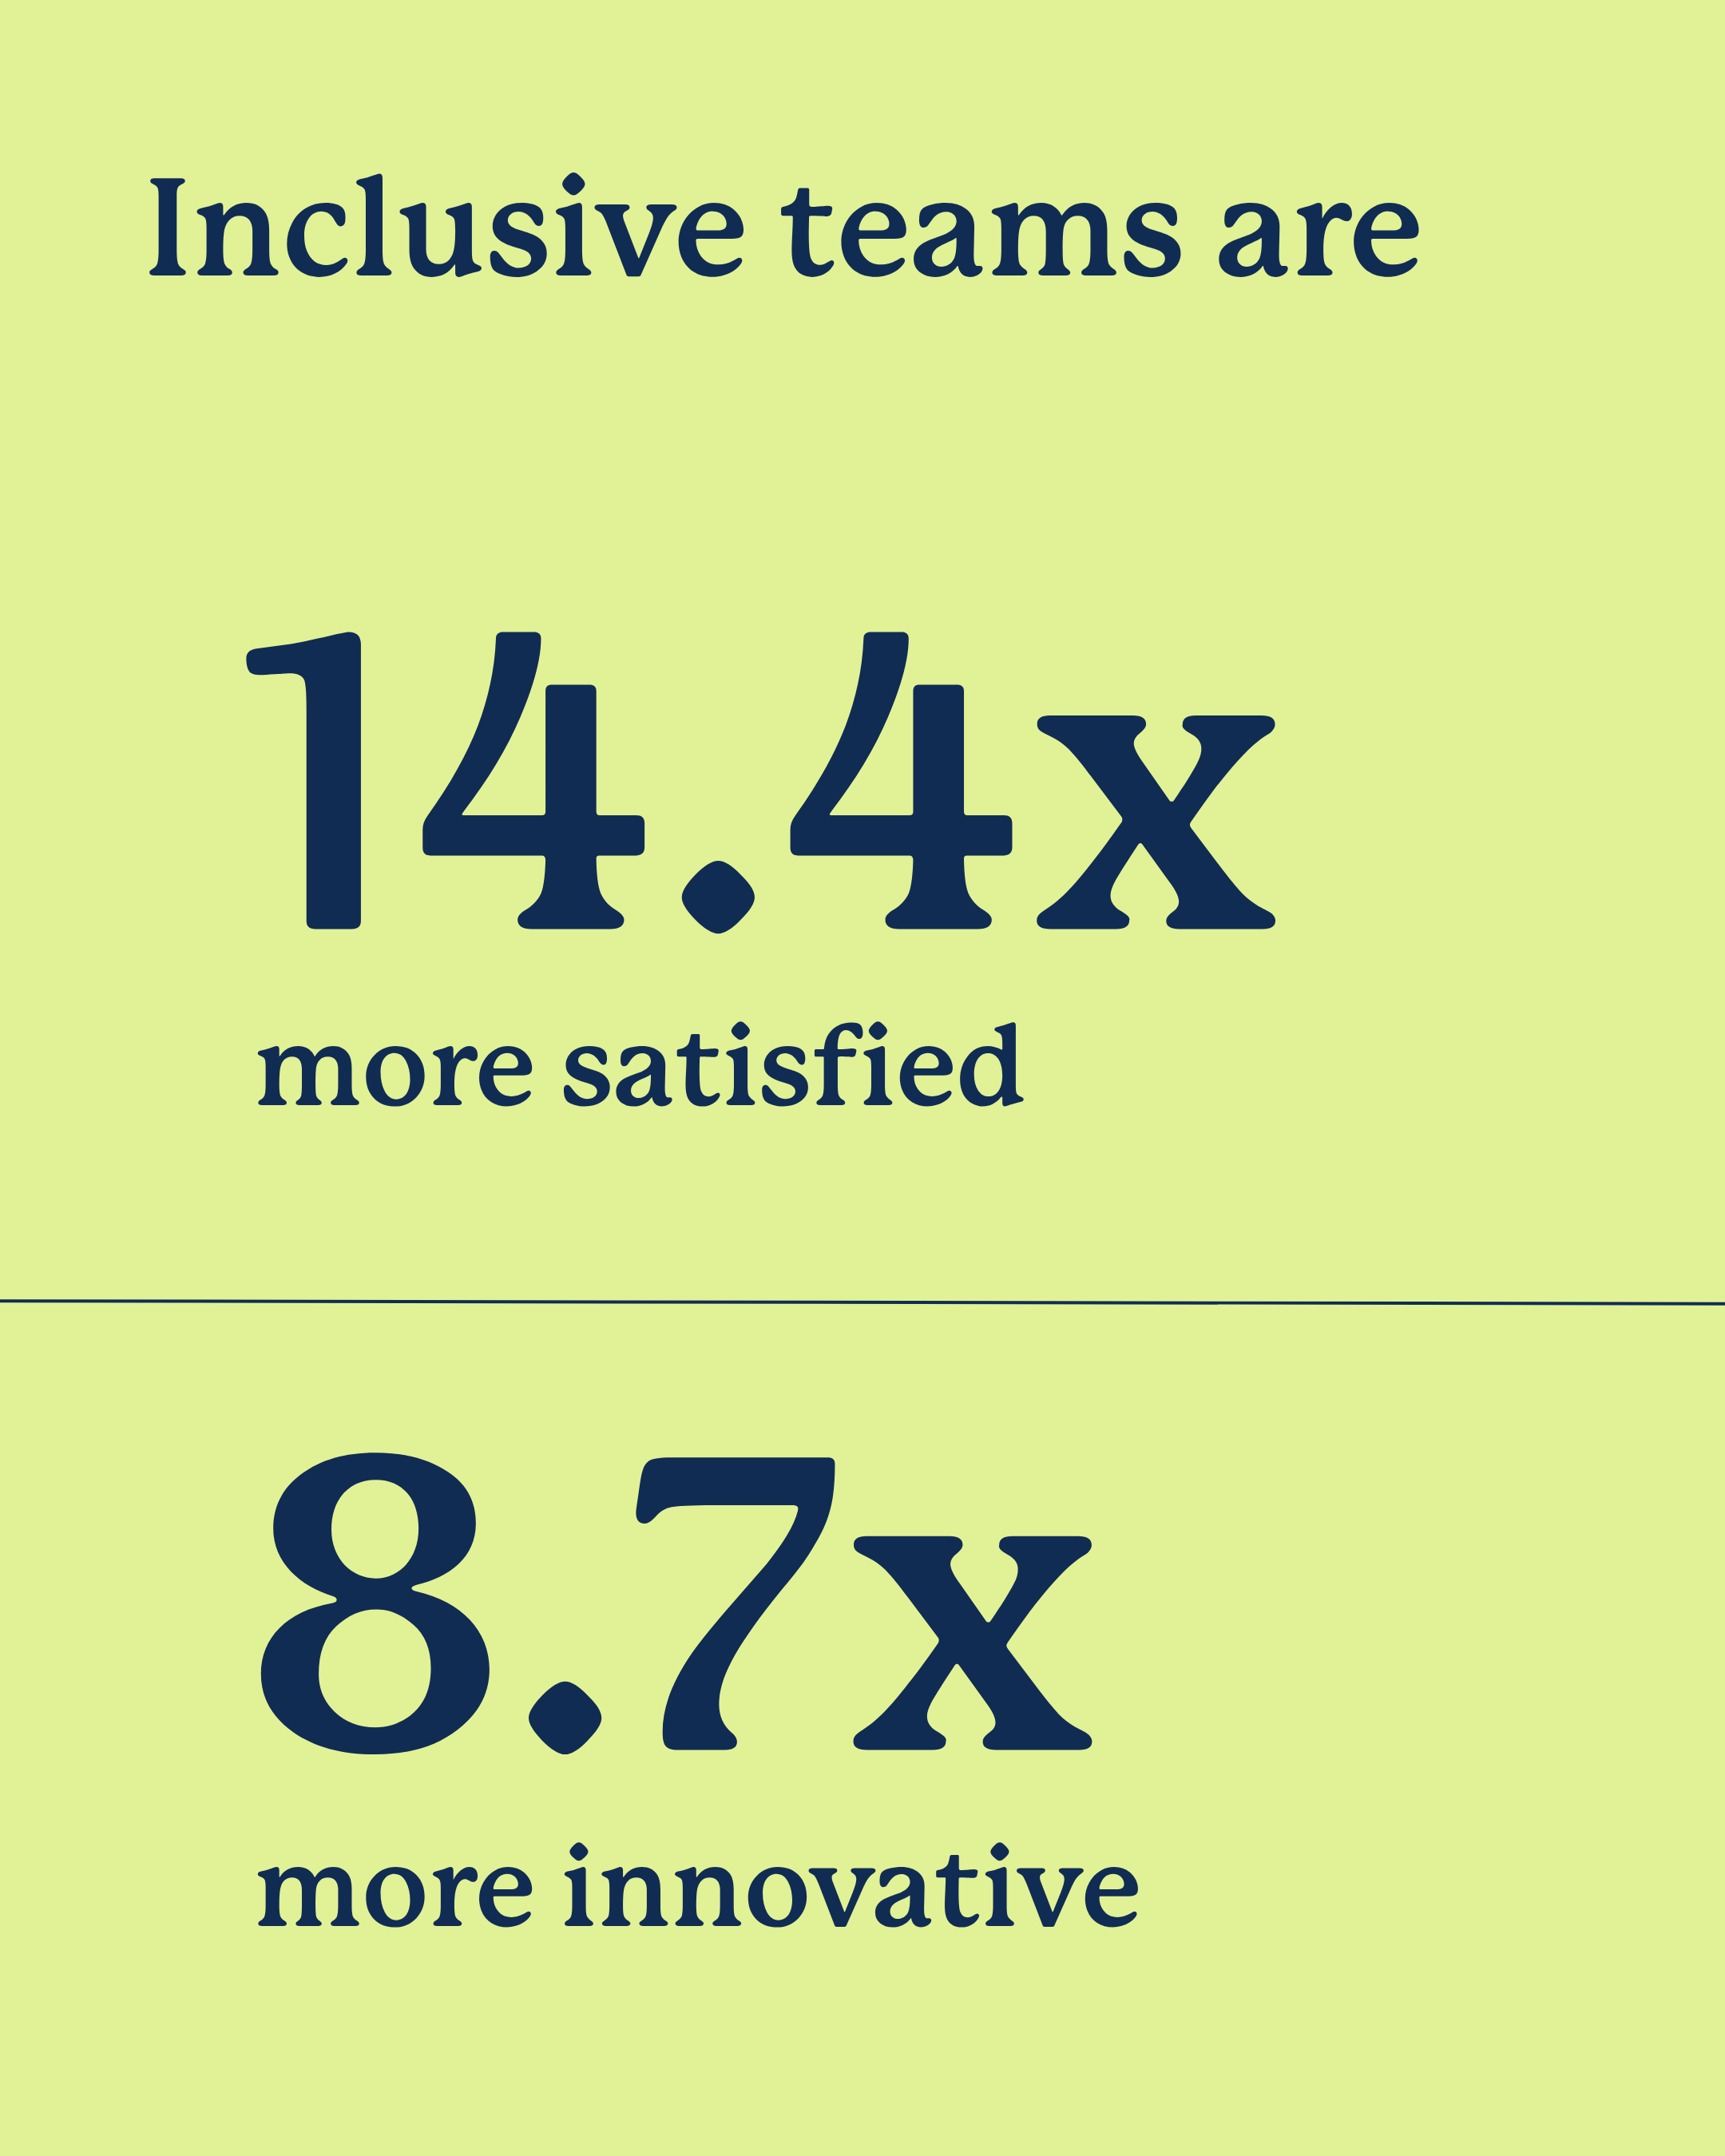
Compared to non-inclusive teams, inclusive teams are:
14.1x more likely to report high job satisfaction.
8.7x more likely to innovate.
7.6x less likely to be planning to leave.
5.5x more likely to work well together.
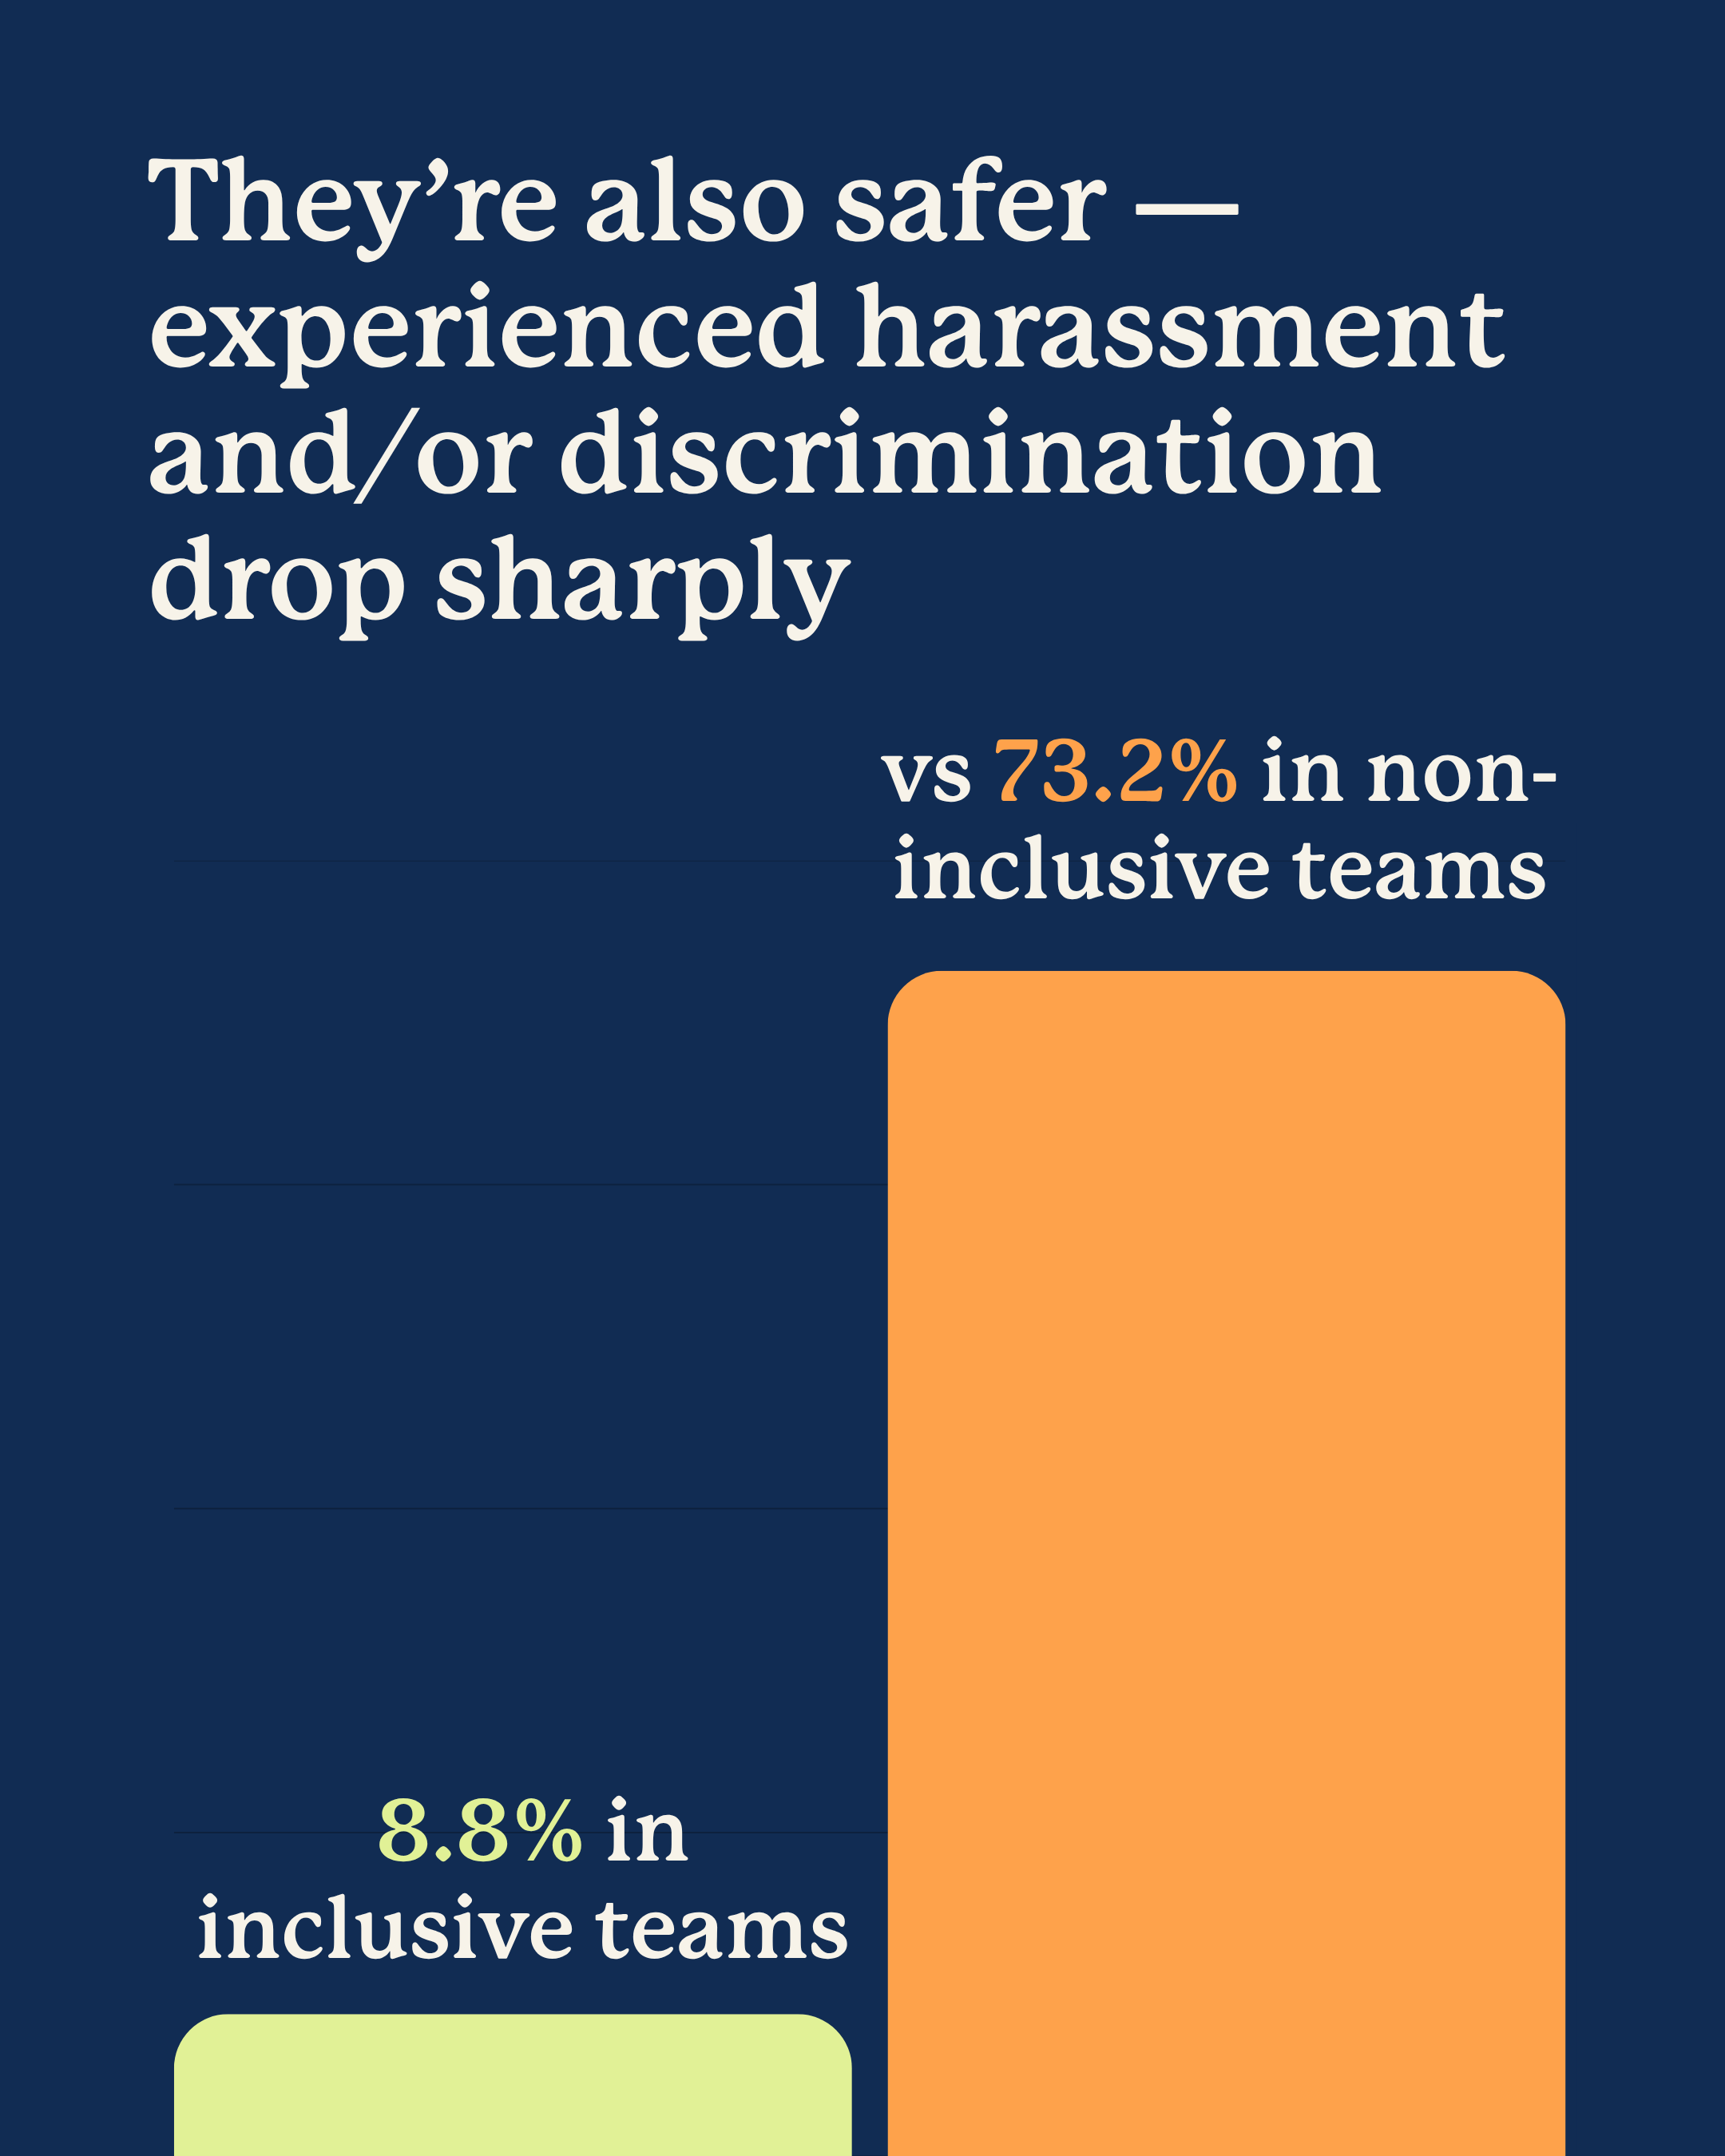
They’re also safer. Experiences of discrimination and harassment drop dramatically in inclusive teams.
Inclusion works — and we know what helps: mentoring, flexible work, employee groups, and respectful leadership.
10. The report is just the beginning.


This is the second time we’ve captured a full-sector snapshot — nearly 1,000 voices across Australia and New Zealand.
Now is the opportunity for your organisation to benchmark itself: are you ahead of the curve — or catching up?
What happens next is up to you:
Inclusion is everyone’s responsibility.
You don’t have to start from scratch.
Free tools and data are ready to support your next step.
